Lab 2
Labs Assignments
This lab will be similar to Lab 1 but will focus specifically on looping with {purrr}.
Part A: Multiple Models
Run the code below to load the following dataset.
file <- "https://github.com/datalorax/esvis/raw/master/data/benchmarks.rda"
load(url(file))
head(benchmarks)
##      sid cohort     sped  ethnicity     frl     ell season reading math
## 1 332347      1 Non-Sped Native Am. Non-FRL Non-ELL Winter     208  205
## 2 400047      1 Non-Sped Native Am.     FRL Non-ELL Spring     212  218
## 3 402107      1 Non-Sped      White Non-FRL Non-ELL Winter     201  212
## 4 402547      1 Non-Sped      White Non-FRL Non-ELL   Fall     185  177
## 5 403047      1     Sped   Hispanic     FRL  Active Winter     179  192
## 6 403307      1     Sped   Hispanic Non-FRL Non-ELL Winter     189  188
These data are simulated, but represent individual student scores across seasonal benchmark screenings (administered in the fall, winter, and spring). The variables are as follows:
sid: student identifiercohort: student cohortsped: special education status of the student for the given time pointethnicity: coded race/ethnicity of the studentfrl: free or reduced price lunch eligibility for the student for the given time pointell: English language learner status for the student for the given time pointseason: season the assessment was administeredreading: student’s reading score at the given time pointmath: student’s mathematics score at the given time point
Recode season to wave with the following code
library(tidyverse)

benchmarks <- benchmarks %>%
	as_tibble() %>%
	mutate(wave = case_when(season == "Fall" ~ 0,
	                        season == "Winter" ~ 1,
	                        TRUE ~ 2))
-
Fit a model of the form
lm(math ~ wave)for each student. -
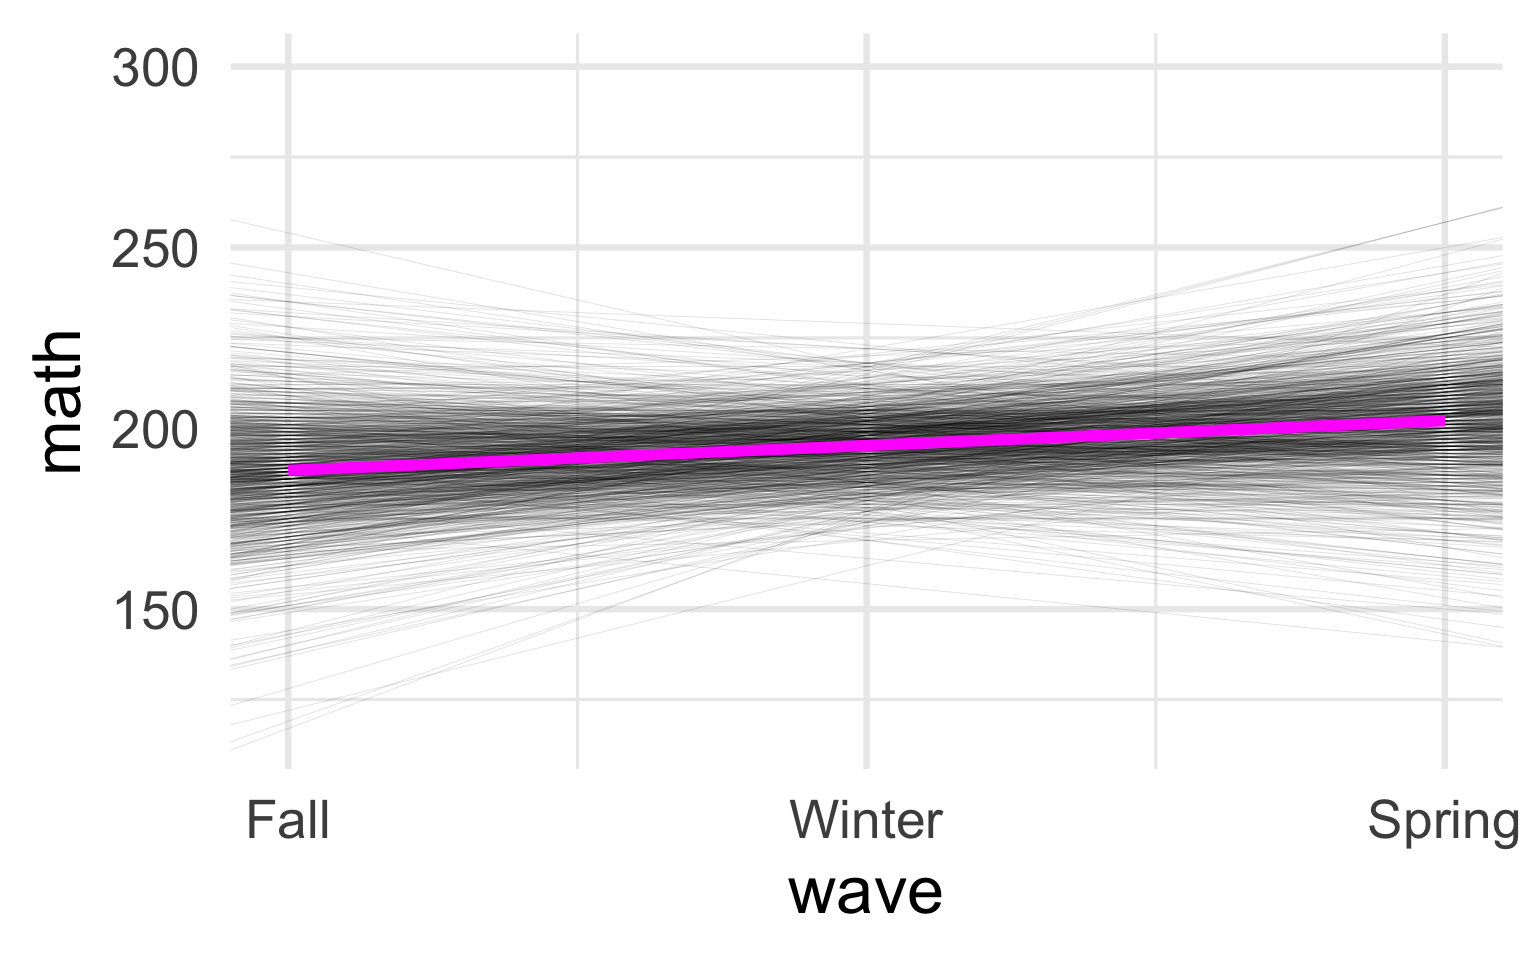
Reproduce the plot plot below. To do so, you will need to pull the intercept and the slope from each individual student (i.e., each model; you can drop any cases where the slope value is
NA). You will then need to put these in a data frame with anidvariable that identifies the student (note - it does not have to be theirsid, just an id from 1 to\(n\)). Finally, fill reproduce the plot useing the below as a guide.
ggplot(benchmarks, aes(wave, math)) +
  geom_abline(
    aes(intercept = ___,
        slope = ___,
        group = ___),
    size = 0.01,
    data = ___
  ) +
  geom_smooth(
    method = "lm",
    se = FALSE,
    color = "magenta",
    size = 2
  ) +
  scale_x_continuous(
    limits = c(0, 2),
    breaks = 0:2,
    labels = c("Fall", "Winter", "Spring")
  ) +
  scale_y_continuous(
    limits = c(115, 300)
  )

Part B: Star Wars
Install and load the {repurrrsive} package
install.packages("repurrrsive")
library(repurrrsive)
You now should have access to all the data you’ll need for the following.
-
Use the
sw_filmslist to identify how many characters were represented in each film. -
Use the
sw_specieslist to (a) identify species that have known hair colors and (b) identify what those hair colors are.
Part C: Some basic API calls
Many of the list elements have urls for API calls. For example
sw_films[[1]]$characters[1]
## [1] "http://swapi.co/api/people/1/"
The above provides the url necessary to make an API call for all the information available on the first character in the first film. Unfortunately, this API has since been deprecated. However, we’re going to use essentially equivalent API calls to instead obtain data about pokemon, via https://pokeapi.co/. Feel free to visit the website and look around.
API’s are a way to host databases on the web, and make the data accessible via API calls. The tidycensus package we used last term, for example, was an R package for interfacing with the US Census API. We’re going to look at abilities of pokemon. For example to obtain data on the first ability, we could run the following
library(httr)
ability1 <- GET("https://pokeapi.co/api/v2/ability/1") %>%
	content("parsed")
The last digit in "https://pokeapi.co/api/v2/ability/1" is just an index denoting that this is the first ability listed in the database. To obtain data on the third ability, we would instead change our call to "https://pokeapi.co/api/v2/ability/3".
If you look at the parsed content (it comes in as JSON data) you will see it is a nested list, just like we worked with above for Star Wars.
We can identify what the specific ability is for ability 1 with
ability1$name
## [1] "stench"
and the number of pokemon with this ability with
length(ability1$pokemon)
## [1] 10
-
Use {purrr} to write an API call to obtain data on the first five abilities (note, we’re only using the first five to make the calls go fast, but the code would be essentially equivalent for any number of abilities you wanted to query). Make sure you parse the JSON data to a list.
-
Use the parsed data to create a data frame that has the given ability, and the number of pokemon with that ability.
Bonus: Up to 1 point extra credit
- Create a new data frame that lists the names of the pokemon with these specific abilities.
Hint: Try to get the name for one pokemon first, then extend out the logic to get all pokemon names. Also, this is really freaking hard so don’t spend too much time on it and don’t worry if you can’t figure it out.