class: center, middle, inverse, title-slide # Intro to Base R iterations ## And Lab 1 ### Daniel Anderson ### Week 2 --- layout: true <script> feather.replace() </script> <div class="slides-footer"> <span> <a class = "footer-icon-link" href = "https://github.com/uo-datasci-specialization/c3-fp-2022/raw/main/static/slides/w2.pdf"> <i class = "footer-icon" data-feather="download"></i> </a> <a class = "footer-icon-link" href = "https://fp-2022.netlify.app/slides/w2.html"> <i class = "footer-icon" data-feather="link"></i> </a> <a class = "footer-icon-link" href = "https://fp-2022.netlify.app/"> <i class = "footer-icon" data-feather="globe"></i> </a> <a class = "footer-icon-link" href = "https://github.com/uo-datasci-specialization/c3-fp-2022"> <i class = "footer-icon" data-feather="github"></i> </a> </span> </div> --- # Agenda * For loops * Apply family of loops + `lapply()` + `sapply()` + `vapply()` + `apply()` (briefly) --- # Learning objectives * Understand the basics of what it means to loop through a vector * Begin to recognize use cases * Be able to apply basic `for` loops and write their equivalents with `lapply`. --- # Basic overview: `for` loops  -- ```r a <- letters[1:26] a ``` ``` ## [1] "a" "b" "c" "d" "e" "f" "g" "h" "i" "j" "k" "l" "m" "n" "o" "p" "q" "r" "s" "t" "u" ## [22] "v" "w" "x" "y" "z" ``` -- .pull-left[ ```r for(i in 1:5){ print(a[i]) } ``` ``` ## [1] "a" ## [1] "b" ## [1] "c" ## [1] "d" ## [1] "e" ``` ] -- .pull-right[ Note these are five different character scalars (atomic vectors of length one). It is NOT a single vector. ] --- # Creating indexes * You will commonly see code like ```r for(i in 1:nrow(df)) ``` * Instead, preference `seq_along()` or `seq_len()`. -- ### Examples ```r x <- c(3, 2.6, 8) seq_along(x) ``` ``` ## [1] 1 2 3 ``` ```r seq_len(length(x)) ``` ``` ## [1] 1 2 3 ``` --- # `seq_*` * `seq_along()` will create an index from 1 to the length of the vector * `seq_len()` takes a single positive integer argument, and creates an index from 1 to that integer -- Why are these preferable? --- # Avoid the `1 0` problem ```r means <- c() out <- rep(NA, length(means)) for (i in 1:length(means)) { out[i] <- rnorm(10, means[i]) } ``` ``` ## Error in rnorm(10, means[i]): invalid arguments ``` -- ### `seq_*` version ```r means <- c() out <- rep(NA, length(means)) for (i in seq_along(means)) { out[i] <- rnorm(10, means[i]) } ``` Basically, the loop is just not executed. --- # Another basic example ### Simulate tossing a coin, record results -- * For a single toss ```r sample(c("Heads", "Tails"), 1) ``` ``` ## [1] "Heads" ``` -- * For multiple tosses, first allocate a vector with `length` equal to the number of iterations ```r result <- rep(NA, 10) result ``` ``` ## [1] NA NA NA NA NA NA NA NA NA NA ``` --- * Next, run the trial `\(n\)` times, storing the result in your pre-allocated vector. ```r for(i in seq_along(result)) { result[i] <- sample(c("Heads", "Tails"), 1) } result ``` ``` ## [1] "Tails" "Heads" "Tails" "Heads" "Tails" "Tails" "Tails" "Heads" "Tails" "Tails" ``` --- # Growing vectors * **Always** pre-allocate a vector for storage before running a `for` loop. -- * Contrary to some opinions you may see out there, `for` loops are not actually slower than `lapply`, etc., provided the `for` loop is written well -- * This primarily means .b[not] growing a vector --- # Example 100,000 coin flips by growing a vector ```r library(tictoc) set.seed(1) tic() not_allocated <- sample(c("Heads", "Tails"), 1) for(i in seq_len(1e5 - 1)) { not_allocated <- c( not_allocated, sample(c("Heads", "Tails"), 1) ) } toc() ``` ``` ## 50.637 sec elapsed ``` --- same *exact* thing with pre-allocated vector ```r set.seed(1) tic() allocated <- rep(NA, 1e5) for(i in seq_len(1e5)) { allocated[i] <- sample(c("Heads", "Tails"), 1) } toc() ``` ``` ## 0.935 sec elapsed ``` --- # Result * The result is the same, regardless of the approach (notice I forced the random number generator to start at the same place in both samples) ```r identical(not_allocated, allocated) ``` ``` ## [1] TRUE ``` * Speed is obviously not identical --- # You try Base R comes with `letters` and `LETTERS` * Make an alphabet of upper/lower case. For example, create "Aa" with `paste0(LETTERS[1], letters[1])` * Write a `for` loop for all letters <div class="countdown" id="timer_6227ce41" style="right:0;bottom:0;" data-warnwhen="0"> <code class="countdown-time"><span class="countdown-digits minutes">03</span><span class="countdown-digits colon">:</span><span class="countdown-digits seconds">00</span></code> </div> --- # Answer ```r alphabet <- rep(NA, length(letters)) for(i in seq_along(alphabet)) { alphabet[i] <- paste0(LETTERS[i], letters[i]) } alphabet ``` ``` ## [1] "Aa" "Bb" "Cc" "Dd" "Ee" "Ff" "Gg" "Hh" "Ii" "Jj" "Kk" "Ll" "Mm" "Nn" "Oo" "Pp" ## [17] "Qq" "Rr" "Ss" "Tt" "Uu" "Vv" "Ww" "Xx" "Yy" "Zz" ``` --- # Another example * Say we wanted to simulate 100 cases from random normal distribution, where we varied the standard deviation in increments of 0.2, ranging from 1 to 5 -- * Hopefully this is a relatable example, but if not, that's okay - focus on the process. -- * First, specify a vector standard deviations ```r increments <- seq(1, 5, by = 0.2) ``` -- * Next, allocate a vector. There are many ways I could store this result (data frame, matrix, list). I'll do it in a list. ```r simulated <- vector("list", length(increments)) ``` --- # Look at our vector ```r str(simulated) ``` ``` ## List of 21 ## $ : NULL ## $ : NULL ## $ : NULL ## $ : NULL ## $ : NULL ## $ : NULL ## $ : NULL ## $ : NULL ## $ : NULL ## $ : NULL ## $ : NULL ## $ : NULL ## $ : NULL ## $ : NULL ## $ : NULL ## $ : NULL ## $ : NULL ## $ : NULL ## $ : NULL ## $ : NULL ## $ : NULL ``` --- # Write `for` loop ```r for(i in seq_along(simulated)) { simulated[[i]] <- rnorm(100, 0, increments[i]) # note use of `[[` above } ``` -- Now look at our vector ```r str(simulated) ``` ``` ## List of 21 ## $ : num [1:100] -2.387 0.405 -1.599 -0.285 0.288 ... ## $ : num [1:100] 0.298 0.433 -1.021 1.384 -0.323 ... ## $ : num [1:100] 0.893 -1.799 -0.819 -1.11 -2.198 ... ## $ : num [1:100] -0.332 1.067 -0.823 2.899 1.863 ... ## $ : num [1:100] -2.568 -0.672 -0.244 -1.645 2.221 ... ## $ : num [1:100] 2.4 -1.95 1.13 3.05 3.56 ... ## $ : num [1:100] -2.978 0.798 2.212 2.15 -2.197 ... ## $ : num [1:100] -0.211 -1.768 3.35 2.06 0.213 ... ## $ : num [1:100] 0.718 -4.029 -1.093 0.417 -3.952 ... ## $ : num [1:100] 0.632 3.084 -2.62 -1.282 -2.965 ... ## $ : num [1:100] 2.1759 -0.4681 1.6349 -0.0809 -0.7611 ... ## $ : num [1:100] 1.236 3.055 -2.575 -0.868 4.369 ... ## $ : num [1:100] 0.7795 -1.0125 -6.465 0.0926 1.8629 ... ## $ : num [1:100] 3.466 -1.245 0.496 3.67 -2.207 ... ## $ : num [1:100] -2.712 -4.21 -3.686 -0.728 -0.142 ... ## $ : num [1:100] 2.83 6.08 -3 4.29 4.18 ... ## $ : num [1:100] 0.335 0.574 4.106 4.414 0.897 ... ## $ : num [1:100] -2.123 3.165 1.104 -4.065 0.578 ... ## $ : num [1:100] 2.448 -1.472 4.411 2.34 -0.346 ... ## $ : num [1:100] 0.672 -4.724 3.378 -1.811 10.33 ... ## $ : num [1:100] -3.46 2.83 -11.49 -1.86 7.54 ... ``` --- # List/data frame * Remember, if all the vectors of our list are the same length, it can be transformed into a data frame. -- * First, let's provide meaningful names ```r names(simulated) <- paste0("sd_", increments) str(simulated) ``` ``` ## List of 21 ## $ sd_1 : num [1:100] -2.387 0.405 -1.599 -0.285 0.288 ... ## $ sd_1.2: num [1:100] 0.298 0.433 -1.021 1.384 -0.323 ... ## $ sd_1.4: num [1:100] 0.893 -1.799 -0.819 -1.11 -2.198 ... ## $ sd_1.6: num [1:100] -0.332 1.067 -0.823 2.899 1.863 ... ## $ sd_1.8: num [1:100] -2.568 -0.672 -0.244 -1.645 2.221 ... ## $ sd_2 : num [1:100] 2.4 -1.95 1.13 3.05 3.56 ... ## $ sd_2.2: num [1:100] -2.978 0.798 2.212 2.15 -2.197 ... ## $ sd_2.4: num [1:100] -0.211 -1.768 3.35 2.06 0.213 ... ## $ sd_2.6: num [1:100] 0.718 -4.029 -1.093 0.417 -3.952 ... ## $ sd_2.8: num [1:100] 0.632 3.084 -2.62 -1.282 -2.965 ... ## $ sd_3 : num [1:100] 2.1759 -0.4681 1.6349 -0.0809 -0.7611 ... ## $ sd_3.2: num [1:100] 1.236 3.055 -2.575 -0.868 4.369 ... ## $ sd_3.4: num [1:100] 0.7795 -1.0125 -6.465 0.0926 1.8629 ... ## $ sd_3.6: num [1:100] 3.466 -1.245 0.496 3.67 -2.207 ... ## $ sd_3.8: num [1:100] -2.712 -4.21 -3.686 -0.728 -0.142 ... ## $ sd_4 : num [1:100] 2.83 6.08 -3 4.29 4.18 ... ## $ sd_4.2: num [1:100] 0.335 0.574 4.106 4.414 0.897 ... ## $ sd_4.4: num [1:100] -2.123 3.165 1.104 -4.065 0.578 ... ## $ sd_4.6: num [1:100] 2.448 -1.472 4.411 2.34 -0.346 ... ## $ sd_4.8: num [1:100] 0.672 -4.724 3.378 -1.811 10.33 ... ## $ sd_5 : num [1:100] -3.46 2.83 -11.49 -1.86 7.54 ... ``` --- # Convert to df ```r sim_d <- data.frame(simulated) head(sim_d) ``` ``` ## sd_1 sd_1.2 sd_1.4 sd_1.6 sd_1.8 sd_2 sd_2.2 ## 1 -2.3872613 0.2979273 0.8930471 -0.3319310 -2.5676229 2.3954045 -2.9775420 ## 2 0.4051212 0.4329239 -1.7989656 1.0673114 -0.6722755 -1.9542566 0.7980123 ## 3 -1.5992856 -1.0209222 -0.8192303 -0.8232251 -0.2435614 1.1309855 2.2118028 ## 4 -0.2847246 1.3838266 -1.1097486 2.8991565 -1.6445420 3.0545722 2.1497809 ## 5 0.2881735 -0.3233308 -2.1982580 1.8633398 2.2213515 3.5578607 -2.1969056 ## 6 0.1175257 -0.4150724 0.6353818 0.7142314 -0.5219616 -0.8029945 0.1464460 ## sd_2.4 sd_2.6 sd_2.8 sd_3 sd_3.2 sd_3.4 sd_3.6 ## 1 -0.2105980 0.7175135 0.6321448 2.17589282 1.2362364 0.77947966 3.4658329 ## 2 -1.7675364 -4.0290962 3.0843027 -0.46812673 3.0554725 -1.01245886 -1.2451870 ## 3 3.3501949 -1.0927053 -2.6196216 1.63492841 -2.5751022 -6.46499466 0.4960868 ## 4 2.0601974 0.4174713 -1.2824915 -0.08085208 -0.8678742 0.09259855 3.6701383 ## 5 0.2125117 -3.9521276 -2.9646399 -0.76111234 4.3687915 1.86290325 -2.2067855 ## 6 1.7822910 -0.1081454 4.5420524 3.53122922 -2.4194781 -1.14660593 -1.7557261 ## sd_3.8 sd_4 sd_4.2 sd_4.4 sd_4.6 sd_4.8 sd_5 ## 1 -2.7119876 2.834307 0.3347596 -2.122876 2.4479578 0.6723229 -3.464762 ## 2 -4.2104097 6.083823 0.5735697 3.164909 -1.4721622 -4.7240885 2.825094 ## 3 -3.6861183 -3.000288 4.1063037 1.104068 4.4111688 3.3779921 -11.486532 ## 4 -0.7277885 4.293730 4.4141833 -4.064636 2.3400425 -1.8110032 -1.857547 ## 5 -0.1416683 4.178344 0.8965279 0.578414 -0.3461786 10.3301558 7.544994 ## 6 -2.2110984 4.644032 -5.7370545 -5.072939 4.7260451 0.4489877 2.956989 ``` --- # tidyverse * One of the *best* things about the tidyverse is that it often does the looping for you .pull-left[ ```r library(tidyverse) pd <- sim_d %>% pivot_longer( everything(), names_to = "sd", values_to = "sim", names_prefix = "sd_", names_ptypes = list( sd = factor() ) ) ggplot(pd, aes(sim)) + geom_density( aes(color = sd) ) + guides(color = "none") ``` ] .pull-right[ <!-- --> ] --- class: inverse-red middle > Of course, someone has to write loops. It doesn't have to be you. > --- Jenny Bryan --- # Base R Method * Calculate all the densities ```r densities <- vector("list", length(sim_d)) for(i in seq_along(densities)) { densities[[i]] <- density(sim_d[ ,i]) } str(densities) ``` ``` ## List of 21 ## $ :List of 7 ## ..$ x : num [1:512] -3.45 -3.44 -3.42 -3.41 -3.4 ... ## ..$ y : num [1:512] 0.000173 0.000195 0.000219 0.000245 0.000274 ... ## ..$ bw : num 0.355 ## ..$ n : int 100 ## ..$ call : language density.default(x = sim_d[, i]) ## ..$ data.name: chr "sim_d[, i]" ## ..$ has.na : logi FALSE ## ..- attr(*, "class")= chr "density" ## $ :List of 7 ## ..$ x : num [1:512] -3.39 -3.38 -3.36 -3.35 -3.33 ... ## ..$ y : num [1:512] 0.000261 0.000296 0.000334 0.000377 0.000425 ... ## ..$ bw : num 0.405 ## ..$ n : int 100 ## ..$ call : language density.default(x = sim_d[, i]) ## ..$ data.name: chr "sim_d[, i]" ## ..$ has.na : logi FALSE ## ..- attr(*, "class")= chr "density" ## $ :List of 7 ## ..$ x : num [1:512] -4.9 -4.88 -4.87 -4.85 -4.83 ... ## ..$ y : num [1:512] 9.72e-05 1.09e-04 1.22e-04 1.37e-04 1.53e-04 ... ## ..$ bw : num 0.495 ## ..$ n : int 100 ## ..$ call : language density.default(x = sim_d[, i]) ## ..$ data.name: chr "sim_d[, i]" ## ..$ has.na : logi FALSE ## ..- attr(*, "class")= chr "density" ## $ :List of 7 ## ..$ x : num [1:512] -5.64 -5.62 -5.59 -5.57 -5.54 ... ## ..$ y : num [1:512] 0.000132 0.00015 0.000171 0.000195 0.000221 ... ## ..$ bw : num 0.572 ## ..$ n : int 100 ## ..$ call : language density.default(x = sim_d[, i]) ## ..$ data.name: chr "sim_d[, i]" ## ..$ has.na : logi FALSE ## ..- attr(*, "class")= chr "density" ## $ :List of 7 ## ..$ x : num [1:512] -5.97 -5.95 -5.92 -5.9 -5.88 ... ## ..$ y : num [1:512] 0.00012 0.000137 0.000155 0.000175 0.000198 ... ## ..$ bw : num 0.559 ## ..$ n : int 100 ## ..$ call : language density.default(x = sim_d[, i]) ## ..$ data.name: chr "sim_d[, i]" ## ..$ has.na : logi FALSE ## ..- attr(*, "class")= chr "density" ## $ :List of 7 ## ..$ x : num [1:512] -5.57 -5.55 -5.53 -5.5 -5.48 ... ## ..$ y : num [1:512] 0.000137 0.000153 0.000169 0.000187 0.000207 ... ## ..$ bw : num 0.698 ## ..$ n : int 100 ## ..$ call : language density.default(x = sim_d[, i]) ## ..$ data.name: chr "sim_d[, i]" ## ..$ has.na : logi FALSE ## ..- attr(*, "class")= chr "density" ## $ :List of 7 ## ..$ x : num [1:512] -7.7 -7.67 -7.64 -7.61 -7.58 ... ## ..$ y : num [1:512] 5.93e-05 6.65e-05 7.46e-05 8.37e-05 9.35e-05 ... ## ..$ bw : num 0.768 ## ..$ n : int 100 ## ..$ call : language density.default(x = sim_d[, i]) ## ..$ data.name: chr "sim_d[, i]" ## ..$ has.na : logi FALSE ## ..- attr(*, "class")= chr "density" ## $ :List of 7 ## ..$ x : num [1:512] -9.48 -9.44 -9.4 -9.37 -9.33 ... ## ..$ y : num [1:512] 5.38e-05 6.18e-05 7.07e-05 8.06e-05 9.17e-05 ... ## ..$ bw : num 0.834 ## ..$ n : int 100 ## ..$ call : language density.default(x = sim_d[, i]) ## ..$ data.name: chr "sim_d[, i]" ## ..$ has.na : logi FALSE ## ..- attr(*, "class")= chr "density" ## $ :List of 7 ## ..$ x : num [1:512] -9.05 -9.02 -8.98 -8.95 -8.91 ... ## ..$ y : num [1:512] 5.98e-05 6.80e-05 7.71e-05 8.74e-05 9.91e-05 ... ## ..$ bw : num 0.813 ## ..$ n : int 100 ## ..$ call : language density.default(x = sim_d[, i]) ## ..$ data.name: chr "sim_d[, i]" ## ..$ has.na : logi FALSE ## ..- attr(*, "class")= chr "density" ## $ :List of 7 ## ..$ x : num [1:512] -9.05 -9.02 -8.99 -8.95 -8.92 ... ## ..$ y : num [1:512] 6.33e-05 7.07e-05 7.87e-05 8.79e-05 9.79e-05 ... ## ..$ bw : num 0.954 ## ..$ n : int 100 ## ..$ call : language density.default(x = sim_d[, i]) ## ..$ data.name: chr "sim_d[, i]" ## ..$ has.na : logi FALSE ## ..- attr(*, "class")= chr "density" ## $ :List of 7 ## ..$ x : num [1:512] -9.69 -9.65 -9.61 -9.57 -9.54 ... ## ..$ y : num [1:512] 0.000107 0.00012 0.000135 0.000151 0.000169 ... ## ..$ bw : num 1.08 ## ..$ n : int 100 ## ..$ call : language density.default(x = sim_d[, i]) ## ..$ data.name: chr "sim_d[, i]" ## ..$ has.na : logi FALSE ## ..- attr(*, "class")= chr "density" ## $ :List of 7 ## ..$ x : num [1:512] -9.73 -9.69 -9.64 -9.6 -9.56 ... ## ..$ y : num [1:512] 9.15e-05 1.03e-04 1.15e-04 1.29e-04 1.44e-04 ... ## ..$ bw : num 1.12 ## ..$ n : int 100 ## ..$ call : language density.default(x = sim_d[, i]) ## ..$ data.name: chr "sim_d[, i]" ## ..$ has.na : logi FALSE ## ..- attr(*, "class")= chr "density" ## $ :List of 7 ## ..$ x : num [1:512] -11.3 -11.2 -11.2 -11.2 -11.1 ... ## ..$ y : num [1:512] 4.55e-05 5.14e-05 5.79e-05 6.53e-05 7.34e-05 ... ## ..$ bw : num 0.989 ## ..$ n : int 100 ## ..$ call : language density.default(x = sim_d[, i]) ## ..$ data.name: chr "sim_d[, i]" ## ..$ has.na : logi FALSE ## ..- attr(*, "class")= chr "density" ## $ :List of 7 ## ..$ x : num [1:512] -12 -11.9 -11.9 -11.8 -11.8 ... ## ..$ y : num [1:512] 4.34e-05 4.86e-05 5.45e-05 6.09e-05 6.78e-05 ... ## ..$ bw : num 1.04 ## ..$ n : int 100 ## ..$ call : language density.default(x = sim_d[, i]) ## ..$ data.name: chr "sim_d[, i]" ## ..$ has.na : logi FALSE ## ..- attr(*, "class")= chr "density" ## $ :List of 7 ## ..$ x : num [1:512] -11 -10.9 -10.9 -10.9 -10.8 ... ## ..$ y : num [1:512] 7.10e-05 7.95e-05 8.87e-05 9.88e-05 1.10e-04 ... ## ..$ bw : num 1.18 ## ..$ n : int 100 ## ..$ call : language density.default(x = sim_d[, i]) ## ..$ data.name: chr "sim_d[, i]" ## ..$ has.na : logi FALSE ## ..- attr(*, "class")= chr "density" ## $ :List of 7 ## ..$ x : num [1:512] -11.6 -11.5 -11.5 -11.4 -11.4 ... ## ..$ y : num [1:512] 6.28e-05 7.04e-05 7.89e-05 8.84e-05 9.87e-05 ... ## ..$ bw : num 1.3 ## ..$ n : int 100 ## ..$ call : language density.default(x = sim_d[, i]) ## ..$ data.name: chr "sim_d[, i]" ## ..$ has.na : logi FALSE ## ..- attr(*, "class")= chr "density" ## $ :List of 7 ## ..$ x : num [1:512] -15 -15 -14.9 -14.9 -14.8 ... ## ..$ y : num [1:512] 3.18e-05 3.64e-05 4.14e-05 4.70e-05 5.32e-05 ... ## ..$ bw : num 1.41 ## ..$ n : int 100 ## ..$ call : language density.default(x = sim_d[, i]) ## ..$ data.name: chr "sim_d[, i]" ## ..$ has.na : logi FALSE ## ..- attr(*, "class")= chr "density" ## $ :List of 7 ## ..$ x : num [1:512] -13.9 -13.9 -13.8 -13.8 -13.7 ... ## ..$ y : num [1:512] 6.35e-05 7.18e-05 8.15e-05 9.22e-05 1.04e-04 ... ## ..$ bw : num 1.4 ## ..$ n : int 100 ## ..$ call : language density.default(x = sim_d[, i]) ## ..$ data.name: chr "sim_d[, i]" ## ..$ has.na : logi FALSE ## ..- attr(*, "class")= chr "density" ## $ :List of 7 ## ..$ x : num [1:512] -15.6 -15.5 -15.5 -15.4 -15.4 ... ## ..$ y : num [1:512] 3.11e-05 3.48e-05 3.88e-05 4.33e-05 4.83e-05 ... ## ..$ bw : num 1.48 ## ..$ n : int 100 ## ..$ call : language density.default(x = sim_d[, i]) ## ..$ data.name: chr "sim_d[, i]" ## ..$ has.na : logi FALSE ## ..- attr(*, "class")= chr "density" ## $ :List of 7 ## ..$ x : num [1:512] -14 -13.9 -13.9 -13.8 -13.7 ... ## ..$ y : num [1:512] 4.97e-05 5.57e-05 6.26e-05 7.01e-05 7.83e-05 ... ## ..$ bw : num 1.78 ## ..$ n : int 100 ## ..$ call : language density.default(x = sim_d[, i]) ## ..$ data.name: chr "sim_d[, i]" ## ..$ has.na : logi FALSE ## ..- attr(*, "class")= chr "density" ## $ :List of 7 ## ..$ x : num [1:512] -17.4 -17.3 -17.2 -17.2 -17.1 ... ## ..$ y : num [1:512] 3.78e-05 4.25e-05 4.76e-05 5.34e-05 5.98e-05 ... ## ..$ bw : num 1.71 ## ..$ n : int 100 ## ..$ call : language density.default(x = sim_d[, i]) ## ..$ data.name: chr "sim_d[, i]" ## ..$ has.na : logi FALSE ## ..- attr(*, "class")= chr "density" ``` --- * Next, plot the first density ```r plot(densities[[1]]) ``` <!-- --> --- * Finally, loop through all the other densities ```r plot(densities[[1]], xlim = c(-20, 20)) for(i in seq(2, length(densities))) { lines(x = densities[[i]]$x, y = densities[[i]]$y) } ``` <!-- --> --- # Skipping iterations * On the prior slide, I set the index to skip over the first by using `seq(2, length(densities))` -- * Alternatively, the loop could have been written like this ```r plot(densities[[1]], xlim = c(-20, 20)) for(i in seq_along(densities)) { if(i == 1) next lines(x = densities[[i]]$x, y = densities[[i]]$y) } ``` <!-- --> --- # Breaking loops * Similarly, if a condition is met, you may want to break out of the loop ```r set.seed(1) rand_unif <- vector("double", 10) for(i in seq_along(rand_unif)) { rand_unif[i] <- runif(1, 0, 10) if(any(rand_unif > 5)) { break } } rand_unif ``` ``` ## [1] 2.655087 3.721239 5.728534 0.000000 0.000000 0.000000 0.000000 0.000000 0.000000 ## [10] 0.000000 ``` --- class: inverse-blue center middle # *apply --- # `lapply` * One of numerous *functionals* in R * A functional "takes a function as an input and returns a vector as output" ([adv-r, Chpt 9](https://adv-r.hadley.nz/functionals.html)) -- * `lapply` will **always** return a list --- ## Revisiting our simulation with `\(n = 10\)` Our `for` loop version ```r increments <- seq(1, 5, by = 0.2) simulated <- vector("list", length(increments)) for(i in seq_along(simulated)) { simulated[[i]] <- rnorm(10, 0, increments[i]) } simulated ``` ``` ## [[1]] ## [1] 1.329799263 1.272429321 0.414641434 -1.539950042 -0.928567035 -0.294720447 ## [7] -0.005767173 2.404653389 0.763593461 -0.799009249 ## ## [[2]] ## [1] -1.3771884 -0.3473539 -0.3590581 -0.4938130 0.3026681 -1.0703054 0.5228200 ## [8] -1.4850461 -0.2691215 0.4528748 ## ## [[3]] ## [1] 0.18667091 1.12586531 -0.07994948 0.70505116 1.52007711 -0.96733538 -1.79843910 ## [8] 0.06541664 -0.32998918 -0.76004356 ## ## [[4]] ## [1] -0.6932965 -1.0391546 1.1628012 1.8430588 1.5874566 -0.6872210 1.9812866 ## [8] -0.4469541 2.8126449 0.8971937 ## ## [[5]] ## [1] -0.8150112 -1.4976779 -2.0998270 -1.9180630 -2.8148077 2.0817666 1.4976848 ## [8] -0.4091916 0.4790473 -0.6780649 ## ## [[6]] ## [1] 4.88272926 -1.59067823 -0.10975495 0.50028265 1.23648659 -0.34524701 -4.44780055 ## [8] -2.52722877 0.71745779 -0.02209096 ## ## [[7]] ## [1] -2.06942816 -0.25481571 -1.79293116 0.53297966 -3.13521647 0.80507047 0.54650783 ## [8] 0.14363400 0.04214406 0.56614443 ## ## [[8]] ## [1] -1.5576242 -0.2860050 1.5939257 2.6423258 0.3450516 -0.2826086 -2.1889641 ## [8] -3.4502070 -1.9130149 3.0097995 ## ## [[9]] ## [1] 2.0075697 -0.5707406 -1.1045067 -1.0893483 2.5921658 -0.7170229 3.2656489 ## [8] 1.6813534 3.3782120 -2.2704815 ## ## [[10]] ## [1] 0.02343869 -2.46644083 1.66952525 0.33520940 -0.79008686 4.07676752 0.64125485 ## [8] 2.79032300 2.18920572 -2.17497454 ## ## [[11]] ## [1] -1.8479697 0.1397409 -3.3911573 1.7301563 -3.8422483 4.8763419 -1.5020898 ## [8] 5.0348916 -1.2375597 -2.9168605 ## ## [[12]] ## [1] 0.08122518 0.08792107 -5.37658471 3.37200276 -3.58271713 1.07397507 1.58334645 ## [8] 0.44176867 -0.38013448 0.63258964 ## ## [[13]] ## [1] -3.63355522 -2.73092494 -3.78680146 5.37231172 5.09258379 0.89299456 -4.19186408 ## [8] -0.01266001 5.13968576 -1.61737417 ## ## [[14]] ## [1] 2.8724992 -3.5064092 2.4817417 -3.4410208 -4.4341454 -3.4448108 -3.1312183 ## [8] -3.2784505 2.6685947 0.2466415 ## ## [[15]] ## [1] -1.230253 -4.128712 -3.860530 -2.917603 -4.254936 -1.703062 1.792598 -4.485865 ## [9] 5.586977 -4.983398 ## ## [[16]] ## [1] -0.38609969 9.47887963 3.56250591 -1.00873265 -3.46305502 2.33034400 -0.05011739 ## [8] -1.49941905 1.27154294 -1.95522254 ## ## [[17]] ## [1] 11.166364 7.057168 3.274253 2.995610 -2.280104 3.720269 -1.464098 -4.233829 ## [9] 7.909367 -3.901679 ## ## [[18]] ## [1] -1.2944644 -2.7057812 -4.1671335 2.6354907 -6.7039055 -0.9072316 -2.5268998 ## [8] -6.1167306 -0.3098365 -1.8958699 ## ## [[19]] ## [1] -2.72423672 4.51313434 2.44908304 -0.41609817 0.71985626 -3.39163378 -0.92616955 ## [8] 5.07001234 -0.07704198 0.74422771 ## ## [[20]] ## [1] 9.71885467 -3.37773242 4.61180344 8.59432826 -5.10799278 0.08465542 -1.87156142 ## [8] -2.35599721 -5.01944473 -4.30181407 ## ## [[21]] ## [1] 6.3469358 2.9692047 3.8781716 7.7868519 -1.8270090 4.0827822 -0.3031739 ## [8] -2.5068916 4.6303136 0.1846885 ``` --- # The `lapply` version ```r increments <- seq(1, 5, by = 0.2) sim_l <- lapply(increments, function(sd) rnorm(10, 0, sd)) sim_l ``` ``` ## [[1]] ## [1] -1.06620017 -0.23845635 1.49522344 1.17215855 -1.45770721 0.09505623 0.84766496 ## [8] -1.62436453 1.40856336 -0.54176036 ## ## [[2]] ## [1] 0.33439767 -0.23276729 1.89138982 -1.77065716 -0.17352985 -1.14384377 0.48785128 ## [8] 2.67511464 -1.81739641 -0.07404891 ## ## [[3]] ## [1] -0.2061791 2.1582303 -1.3745979 0.6952094 2.3757270 -0.3650308 -0.9883000 ## [8] -0.2256499 0.7018506 -1.4189555 ## ## [[4]] ## [1] 2.583603577 0.009027176 -4.647838497 -1.771463710 2.476107092 -1.562928561 ## [7] -0.162405516 0.068240400 -2.554748823 0.785547796 ## ## [[5]] ## [1] 0.7588861 3.3730270 1.8621258 0.1472586 -0.1485428 1.0909322 -1.5973563 ## [8] 0.1897585 0.6351741 0.9907080 ## ## [[6]] ## [1] -2.2686619 2.9247031 1.4042334 5.0142223 -3.7800543 -1.1796256 -3.4290046 ## [8] -0.8419958 0.6202828 3.4051412 ## ## [[7]] ## [1] -0.9754466 -2.6369136 -0.6762380 1.3663192 0.4001848 2.9004820 -0.6576005 ## [8] -3.6260878 2.0932966 -2.4488705 ## ## [[8]] ## [1] 1.4807195 1.2323849 0.8867018 4.1373459 -0.4947470 -3.1540683 0.1523378 ## [8] -0.5567459 1.5241448 3.9231463 ## ## [[9]] ## [1] -4.7016517 -0.5561035 0.1829520 1.4292399 -1.8117412 1.0154715 0.9916693 ## [8] -0.0321692 -0.3235310 3.8135359 ## ## [[10]] ## [1] 1.8870003 5.4779907 -0.7533148 -3.4847443 -1.1079682 0.2727106 -0.6674835 ## [8] -1.1531183 -4.4162105 -2.2323731 ## ## [[11]] ## [1] -3.2887103 0.9249262 1.0343854 4.6189443 -0.9885426 2.8451681 -1.4377668 ## [8] -4.5446604 1.3036100 -1.5586100 ## ## [[12]] ## [1] -2.6705889 -2.4212723 3.4864112 5.0317853 3.2235660 -0.8741056 -4.1909745 ## [8] 0.7122363 3.5629862 2.6796621 ## ## [[13]] ## [1] 1.0693570 0.7555414 -2.8682923 1.5089381 0.1897102 0.2311061 -0.6866699 ## [8] -3.9372519 -2.0153271 2.6046223 ## ## [[14]] ## [1] 0.14014122 0.05272852 -0.67074108 5.04212698 0.06654805 0.89710564 0.53719465 ## [8] -3.46763945 -0.23928039 4.63291935 ## ## [[15]] ## [1] 1.7408760 -5.5177075 0.2939007 2.1276020 -0.2847970 2.9742513 -0.6561405 ## [8] -3.9949164 2.7719149 0.9981279 ## ## [[16]] ## [1] 2.1746314 4.1642412 0.7900246 -6.5183131 0.4841609 -6.5496878 -2.1241724 ## [8] 3.8147192 -6.8826026 0.4252825 ## ## [[17]] ## [1] -2.5564077 -1.2650273 4.1000506 1.9152364 5.4365139 -4.7594493 -3.6517335 ## [8] -3.1708752 -0.5444685 -4.2075656 ## ## [[18]] ## [1] -3.6074204 -4.2880309 2.6589614 2.4146654 4.0323037 11.7108920 -0.7931311 ## [8] 3.0140650 14.3722239 2.4666420 ## ## [[19]] ## [1] -0.3174796 -4.4732375 -2.5142983 -7.7679847 -7.2329144 -1.8629409 1.4687175 ## [8] 0.1859673 -1.7940440 -8.3684223 ## ## [[20]] ## [1] 3.1640674 2.2061840 7.7598064 -8.9097144 -1.3767546 8.4015451 0.5587853 ## [8] 6.6444152 2.7562604 0.6551559 ## ## [[21]] ## [1] 4.57107994 -9.00413159 -1.69940320 3.03132286 6.70565155 3.83643644 0.96862833 ## [8] 5.70283345 0.06932402 -5.52652955 ``` --- # Some more examples ### Loop through a data frame * Remember - a data frame is a list. We can loop through it easily -- ```r library(palmerpenguins) lapply(penguins, is.double) ``` ``` ## $species ## [1] FALSE ## ## $island ## [1] FALSE ## ## $bill_length_mm ## [1] TRUE ## ## $bill_depth_mm ## [1] TRUE ## ## $flipper_length_mm ## [1] FALSE ## ## $body_mass_g ## [1] FALSE ## ## $sex ## [1] FALSE ## ## $year ## [1] FALSE ``` --- ```r lapply(mtcars, mean) ``` ``` ## $mpg ## [1] 20.09062 ## ## $cyl ## [1] 6.1875 ## ## $disp ## [1] 230.7219 ## ## $hp ## [1] 146.6875 ## ## $drat ## [1] 3.596563 ## ## $wt ## [1] 3.21725 ## ## $qsec ## [1] 17.84875 ## ## $vs ## [1] 0.4375 ## ## $am ## [1] 0.40625 ## ## $gear ## [1] 3.6875 ## ## $carb ## [1] 2.8125 ``` --- # Add a condition ```r lapply(penguins, function(x) { if(is.numeric(x)) { mean(x, na.rm = TRUE) } }) ``` ``` ## $species ## NULL ## ## $island ## NULL ## ## $bill_length_mm ## [1] 43.92193 ## ## $bill_depth_mm ## [1] 17.15117 ## ## $flipper_length_mm ## [1] 200.9152 ## ## $body_mass_g ## [1] 4201.754 ## ## $sex ## NULL ## ## $year ## [1] 2008.029 ``` --- # Add a second condition ```r lapply(penguins, function(x) { if(is.numeric(x)) { return(mean(x, na.rm = TRUE)) } else if(is.character(x) | is.factor(x)) { return(table(x)) } }) ``` ``` ## $species ## x ## Adelie Chinstrap Gentoo ## 152 68 124 ## ## $island ## x ## Biscoe Dream Torgersen ## 168 124 52 ## ## $bill_length_mm ## [1] 43.92193 ## ## $bill_depth_mm ## [1] 17.15117 ## ## $flipper_length_mm ## [1] 200.9152 ## ## $body_mass_g ## [1] 4201.754 ## ## $sex ## x ## female male ## 165 168 ## ## $year ## [1] 2008.029 ``` --- # Passing arguments There's missing data, so this won't work ```r head(airquality) ``` ``` ## Ozone Solar.R Wind Temp Month Day ## 1 41 190 7.4 67 5 1 ## 2 36 118 8.0 72 5 2 ## 3 12 149 12.6 74 5 3 ## 4 18 313 11.5 62 5 4 ## 5 NA NA 14.3 56 5 5 ## 6 28 NA 14.9 66 5 6 ``` ```r lapply(airquality, mean) ``` ``` ## $Ozone ## [1] NA ## ## $Solar.R ## [1] NA ## ## $Wind ## [1] 9.957516 ## ## $Temp ## [1] 77.88235 ## ## $Month ## [1] 6.993464 ## ## $Day ## [1] 15.80392 ``` --- But this will. ```r lapply(airquality, mean, na.rm = TRUE) ``` ``` ## $Ozone ## [1] 42.12931 ## ## $Solar.R ## [1] 185.9315 ## ## $Wind ## [1] 9.957516 ## ## $Temp ## [1] 77.88235 ## ## $Month ## [1] 6.993464 ## ## $Day ## [1] 15.80392 ``` --- # Alternative notation The prior code could also be written like this ```r lapply(airquality, function(x) mean(x, na.rm = TRUE)) ``` ``` ## $Ozone ## [1] 42.12931 ## ## $Solar.R ## [1] 185.9315 ## ## $Wind ## [1] 9.957516 ## ## $Temp ## [1] 77.88235 ## ## $Month ## [1] 6.993464 ## ## $Day ## [1] 15.80392 ``` --- # Simulation again ```r lapply(seq(1, 5, 0.2), rnorm, n = 10, mean = 0) ``` ``` ## [[1]] ## [1] -0.02516264 -0.16367334 0.37005975 -0.38082454 0.65295237 2.06134181 -1.79664494 ## [8] 0.58407712 -0.72275312 -0.62916466 ## ## [[2]] ## [1] -2.1794473 -0.3111469 0.4015587 -1.7126011 2.3263539 -0.9114363 -2.7345314 ## [8] -0.1368609 2.8222280 1.9155850 ## ## [[3]] ## [1] 1.7884237 1.1045592 0.6460515 -0.6132968 -2.1109298 -3.1121246 -1.6501414 ## [8] -2.4958643 -1.3830868 1.0198842 ## ## [[4]] ## [1] -1.4154959 -2.4615063 -1.6710007 -2.7490179 1.2860121 -2.4028595 -0.2327985 ## [8] 0.9271338 1.9224409 3.0302573 ## ## [[5]] ## [1] -3.1684074 1.6641842 -1.0017759 -0.3250514 2.6053925 -1.0928366 1.2228524 ## [8] -0.1684038 -0.8821553 2.5391869 ## ## [[6]] ## [1] -0.4491476 -0.4249910 1.3927569 1.8303650 -1.8467486 2.2937465 -1.2717301 ## [8] -1.7728866 -4.6662734 -0.2909816 ## ## [[7]] ## [1] 0.6973209 -1.5564340 2.7327422 1.3643348 0.2197867 3.9769477 -3.3053460 ## [8] 0.6284090 1.8605553 -2.1897538 ## ## [[8]] ## [1] -0.6164499 -0.1340545 -1.0680126 0.1672682 -0.3712121 -1.9950323 1.8277064 ## [8] -1.3836166 -1.5032837 1.1552048 ## ## [[9]] ## [1] 4.40770482 -4.57918836 0.51483384 1.03310766 0.07598629 6.65671081 3.26853205 ## [8] -1.38979798 -1.62559131 2.37600659 ## ## [[10]] ## [1] 2.82015870 2.01401711 -1.69319265 1.50935234 -0.21512648 5.17977477 -2.39374114 ## [8] 0.09138443 -2.87016655 -2.75029741 ## ## [[11]] ## [1] 0.01230587 -0.70028153 -1.49666466 4.64913889 0.26249075 3.95610339 -2.94367236 ## [8] -0.73686776 -4.21180151 4.32267944 ## ## [[12]] ## [1] -3.14035197 4.71758369 -3.17183118 -0.30239150 -9.20045339 -0.78997152 0.04718235 ## [8] -6.14108065 -0.92100398 -1.10923983 ## ## [[13]] ## [1] -6.2546012 3.0552024 -4.1237070 -0.7444784 1.9185117 -1.7864769 2.5308724 ## [8] 0.4385380 5.0601325 -2.2531186 ## ## [[14]] ## [1] -4.1783580 1.2915872 -0.7014470 -1.0630152 1.7879055 1.7456860 0.0676242 ## [8] 2.2851884 2.7159987 3.0009205 ## ## [[15]] ## [1] 3.6698929 4.9167439 -0.5188939 -1.6725270 -4.6636789 -0.9030817 -3.5220610 ## [8] 1.5626944 -0.7556854 -2.1183086 ## ## [[16]] ## [1] -3.908628 0.242941 -2.388918 -5.035795 -5.640189 4.405216 -2.708968 -3.048694 ## [9] -1.166994 -2.300754 ## ## [[17]] ## [1] -1.8645558 -1.3127959 -2.5326186 -4.5945258 3.0017660 -0.4570115 -6.0639513 ## [8] 3.3857177 -7.3073073 -1.6855453 ## ## [[18]] ## [1] -1.265363 -4.128993 1.265735 -6.623765 6.684907 1.616601 7.479395 2.834467 ## [9] -7.426325 2.849642 ## ## [[19]] ## [1] 2.064453 4.720990 4.944900 2.108224 2.905299 -2.670145 7.287284 -8.114368 ## [9] -8.650861 -5.941908 ## ## [[20]] ## [1] 4.36641814 -5.31722727 -1.84379460 0.39712720 -2.32263588 -10.00675740 ## [7] 5.60441743 -0.36876370 2.54602270 0.02356222 ## ## [[21]] ## [1] -2.6511571 7.5743333 4.0772982 -7.5326093 -5.7859009 6.5077747 -4.5282039 ## [8] 0.0778174 -7.1400260 3.4398985 ``` --- class: inverse-red middle # Operations by group --- # Mimic `dplyr::group_by` ```r by_cyl <- split(mtcars, mtcars$cyl) str(by_cyl) ``` ``` ## List of 3 ## $ 4:'data.frame': 11 obs. of 11 variables: ## ..$ mpg : num [1:11] 22.8 24.4 22.8 32.4 30.4 33.9 21.5 27.3 26 30.4 ... ## ..$ cyl : num [1:11] 4 4 4 4 4 4 4 4 4 4 ... ## ..$ disp: num [1:11] 108 146.7 140.8 78.7 75.7 ... ## ..$ hp : num [1:11] 93 62 95 66 52 65 97 66 91 113 ... ## ..$ drat: num [1:11] 3.85 3.69 3.92 4.08 4.93 4.22 3.7 4.08 4.43 3.77 ... ## ..$ wt : num [1:11] 2.32 3.19 3.15 2.2 1.61 ... ## ..$ qsec: num [1:11] 18.6 20 22.9 19.5 18.5 ... ## ..$ vs : num [1:11] 1 1 1 1 1 1 1 1 0 1 ... ## ..$ am : num [1:11] 1 0 0 1 1 1 0 1 1 1 ... ## ..$ gear: num [1:11] 4 4 4 4 4 4 3 4 5 5 ... ## ..$ carb: num [1:11] 1 2 2 1 2 1 1 1 2 2 ... ## $ 6:'data.frame': 7 obs. of 11 variables: ## ..$ mpg : num [1:7] 21 21 21.4 18.1 19.2 17.8 19.7 ## ..$ cyl : num [1:7] 6 6 6 6 6 6 6 ## ..$ disp: num [1:7] 160 160 258 225 168 ... ## ..$ hp : num [1:7] 110 110 110 105 123 123 175 ## ..$ drat: num [1:7] 3.9 3.9 3.08 2.76 3.92 3.92 3.62 ## ..$ wt : num [1:7] 2.62 2.88 3.21 3.46 3.44 ... ## ..$ qsec: num [1:7] 16.5 17 19.4 20.2 18.3 ... ## ..$ vs : num [1:7] 0 0 1 1 1 1 0 ## ..$ am : num [1:7] 1 1 0 0 0 0 1 ## ..$ gear: num [1:7] 4 4 3 3 4 4 5 ## ..$ carb: num [1:7] 4 4 1 1 4 4 6 ## $ 8:'data.frame': 14 obs. of 11 variables: ## ..$ mpg : num [1:14] 18.7 14.3 16.4 17.3 15.2 10.4 10.4 14.7 15.5 15.2 ... ## ..$ cyl : num [1:14] 8 8 8 8 8 8 8 8 8 8 ... ## ..$ disp: num [1:14] 360 360 276 276 276 ... ## ..$ hp : num [1:14] 175 245 180 180 180 205 215 230 150 150 ... ## ..$ drat: num [1:14] 3.15 3.21 3.07 3.07 3.07 2.93 3 3.23 2.76 3.15 ... ## ..$ wt : num [1:14] 3.44 3.57 4.07 3.73 3.78 ... ## ..$ qsec: num [1:14] 17 15.8 17.4 17.6 18 ... ## ..$ vs : num [1:14] 0 0 0 0 0 0 0 0 0 0 ... ## ..$ am : num [1:14] 0 0 0 0 0 0 0 0 0 0 ... ## ..$ gear: num [1:14] 3 3 3 3 3 3 3 3 3 3 ... ## ..$ carb: num [1:14] 2 4 3 3 3 4 4 4 2 2 ... ``` --- ```r lapply(by_cyl, function(x) mean(x$mpg)) ``` ``` ## $`4` ## [1] 26.66364 ## ## $`6` ## [1] 19.74286 ## ## $`8` ## [1] 15.1 ``` --- # Your turn Try splitting the penguins dataset by species and calculating the average `bill_length_mm` <div class="countdown" id="timer_6227ce30" style="right:0;bottom:0;" data-warnwhen="0"> <code class="countdown-time"><span class="countdown-digits minutes">04</span><span class="countdown-digits colon">:</span><span class="countdown-digits seconds">00</span></code> </div> --- class: inverse-blue middle # [demo] --- # Produce separate plots ```r lapply(by_cyl, function(x) { ggplot(x, aes(disp, mpg)) + geom_point() + geom_smooth() }) ``` --- ``` ## $`4` ``` 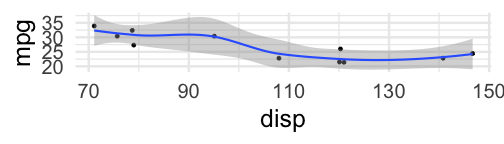<!-- --> ``` ## ## $`6` ``` 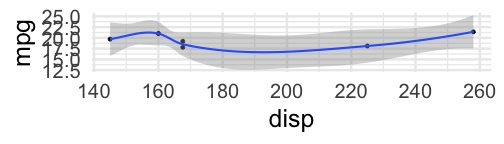<!-- --> ``` ## ## $`8` ``` 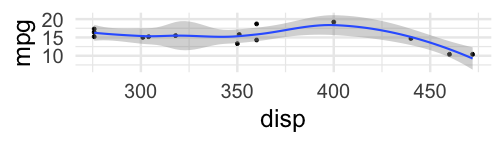<!-- --> --- # Your turn Produce separate plots of the relation between `bill_length_mm` and `body_mass_g` <div class="countdown" id="timer_6227cbe1" style="right:0;bottom:0;" data-warnwhen="0"> <code class="countdown-time"><span class="countdown-digits minutes">04</span><span class="countdown-digits colon">:</span><span class="countdown-digits seconds">00</span></code> </div> --- # Saving * You can extend this example further by saving the plot outputs to an object, then looping through that object to save the plots to disk. -- * Using functionals, this would require parallel iterations, which we'll cover later (need to loop through plots and a file name) -- * Could extend it fairly easily with a `for` loop --- # Saving w/`for` loop ### Save plots to an object (list) ```r plots <- lapply(by_cyl, function(x) { ggplot(x, aes(disp, mpg)) + geom_point() + geom_smooth() }) ``` -- ### Specify file names/directory ```r #dir.create(here::here("plots")) filenames <- here::here( "plots", paste0("cyl", names(by_cyl), ".png") ) filenames ``` ``` ## [1] "/Users/daniel/Teaching/data_sci_specialization/2021-22/c3-fp-2022/plots/cyl4.png" ## [2] "/Users/daniel/Teaching/data_sci_specialization/2021-22/c3-fp-2022/plots/cyl6.png" ## [3] "/Users/daniel/Teaching/data_sci_specialization/2021-22/c3-fp-2022/plots/cyl8.png" ``` --- # Saving ```r for(i in seq_along(plots)) { ggsave(filenames[i], # single bracket plots[[i]], # double bracket device = "png", width = 6.5, height = 8) } ``` --- class: inverse-orange middle # You try! <div class="countdown" id="timer_6227cba0" style="right:0;bottom:0;" data-warnwhen="0"> <code class="countdown-time"><span class="countdown-digits minutes">04</span><span class="countdown-digits colon">:</span><span class="countdown-digits seconds">00</span></code> </div> --- # More than one groups Let's say we wanted to create a plot of bill length vs bill depth by for each combination of species/island. Just split by both! Pass both variables as a `list()`. ```r splt2 <- split( penguins, list(penguins$species, penguins$island) ) ``` --- # Inspect it ```r splt2 ``` ``` ## $Adelie.Biscoe ## # A tibble: 44 × 8 ## species island bill_length_mm bill_depth_mm flipper_length_mm body_mass_g sex ## <fct> <fct> <dbl> <dbl> <int> <int> <fct> ## 1 Adelie Biscoe 37.8 18.3 174 3400 female ## 2 Adelie Biscoe 37.7 18.7 180 3600 male ## 3 Adelie Biscoe 35.9 19.2 189 3800 female ## 4 Adelie Biscoe 38.2 18.1 185 3950 male ## 5 Adelie Biscoe 38.8 17.2 180 3800 male ## 6 Adelie Biscoe 35.3 18.9 187 3800 female ## 7 Adelie Biscoe 40.6 18.6 183 3550 male ## 8 Adelie Biscoe 40.5 17.9 187 3200 female ## 9 Adelie Biscoe 37.9 18.6 172 3150 female ## 10 Adelie Biscoe 40.5 18.9 180 3950 male ## # … with 34 more rows, and 1 more variable: year <int> ## ## $Chinstrap.Biscoe ## # A tibble: 0 × 8 ## # … with 8 variables: species <fct>, island <fct>, bill_length_mm <dbl>, ## # bill_depth_mm <dbl>, flipper_length_mm <int>, body_mass_g <int>, sex <fct>, ## # year <int> ## ## $Gentoo.Biscoe ## # A tibble: 124 × 8 ## species island bill_length_mm bill_depth_mm flipper_length_mm body_mass_g sex ## <fct> <fct> <dbl> <dbl> <int> <int> <fct> ## 1 Gentoo Biscoe 46.1 13.2 211 4500 female ## 2 Gentoo Biscoe 50 16.3 230 5700 male ## 3 Gentoo Biscoe 48.7 14.1 210 4450 female ## 4 Gentoo Biscoe 50 15.2 218 5700 male ## 5 Gentoo Biscoe 47.6 14.5 215 5400 male ## 6 Gentoo Biscoe 46.5 13.5 210 4550 female ## 7 Gentoo Biscoe 45.4 14.6 211 4800 female ## 8 Gentoo Biscoe 46.7 15.3 219 5200 male ## 9 Gentoo Biscoe 43.3 13.4 209 4400 female ## 10 Gentoo Biscoe 46.8 15.4 215 5150 male ## # … with 114 more rows, and 1 more variable: year <int> ## ## $Adelie.Dream ## # A tibble: 56 × 8 ## species island bill_length_mm bill_depth_mm flipper_length_mm body_mass_g sex ## <fct> <fct> <dbl> <dbl> <int> <int> <fct> ## 1 Adelie Dream 39.5 16.7 178 3250 female ## 2 Adelie Dream 37.2 18.1 178 3900 male ## 3 Adelie Dream 39.5 17.8 188 3300 female ## 4 Adelie Dream 40.9 18.9 184 3900 male ## 5 Adelie Dream 36.4 17 195 3325 female ## 6 Adelie Dream 39.2 21.1 196 4150 male ## 7 Adelie Dream 38.8 20 190 3950 male ## 8 Adelie Dream 42.2 18.5 180 3550 female ## 9 Adelie Dream 37.6 19.3 181 3300 female ## 10 Adelie Dream 39.8 19.1 184 4650 male ## # … with 46 more rows, and 1 more variable: year <int> ## ## $Chinstrap.Dream ## # A tibble: 68 × 8 ## species island bill_length_mm bill_depth_mm flipper_length_mm body_mass_g sex ## <fct> <fct> <dbl> <dbl> <int> <int> <fct> ## 1 Chinstrap Dream 46.5 17.9 192 3500 female ## 2 Chinstrap Dream 50 19.5 196 3900 male ## 3 Chinstrap Dream 51.3 19.2 193 3650 male ## 4 Chinstrap Dream 45.4 18.7 188 3525 female ## 5 Chinstrap Dream 52.7 19.8 197 3725 male ## 6 Chinstrap Dream 45.2 17.8 198 3950 female ## 7 Chinstrap Dream 46.1 18.2 178 3250 female ## 8 Chinstrap Dream 51.3 18.2 197 3750 male ## 9 Chinstrap Dream 46 18.9 195 4150 female ## 10 Chinstrap Dream 51.3 19.9 198 3700 male ## # … with 58 more rows, and 1 more variable: year <int> ## ## $Gentoo.Dream ## # A tibble: 0 × 8 ## # … with 8 variables: species <fct>, island <fct>, bill_length_mm <dbl>, ## # bill_depth_mm <dbl>, flipper_length_mm <int>, body_mass_g <int>, sex <fct>, ## # year <int> ## ## $Adelie.Torgersen ## # A tibble: 52 × 8 ## species island bill_length_mm bill_depth_mm flipper_length_mm body_mass_g sex ## <fct> <fct> <dbl> <dbl> <int> <int> <fct> ## 1 Adelie Torgersen 39.1 18.7 181 3750 male ## 2 Adelie Torgersen 39.5 17.4 186 3800 female ## 3 Adelie Torgersen 40.3 18 195 3250 female ## 4 Adelie Torgersen NA NA NA NA <NA> ## 5 Adelie Torgersen 36.7 19.3 193 3450 female ## 6 Adelie Torgersen 39.3 20.6 190 3650 male ## 7 Adelie Torgersen 38.9 17.8 181 3625 female ## 8 Adelie Torgersen 39.2 19.6 195 4675 male ## 9 Adelie Torgersen 34.1 18.1 193 3475 <NA> ## 10 Adelie Torgersen 42 20.2 190 4250 <NA> ## # … with 42 more rows, and 1 more variable: year <int> ## ## $Chinstrap.Torgersen ## # A tibble: 0 × 8 ## # … with 8 variables: species <fct>, island <fct>, bill_length_mm <dbl>, ## # bill_depth_mm <dbl>, flipper_length_mm <int>, body_mass_g <int>, sex <fct>, ## # year <int> ## ## $Gentoo.Torgersen ## # A tibble: 0 × 8 ## # … with 8 variables: species <fct>, island <fct>, bill_length_mm <dbl>, ## # bill_depth_mm <dbl>, flipper_length_mm <int>, body_mass_g <int>, sex <fct>, ## # year <int> ``` --- # Create plots ```r plots2 <- lapply(splt2, function(x) { ggplot(x, aes(bill_length_mm, bill_depth_mm)) + geom_point() }) ``` --- # First few ```r plots2[[1]] ``` <!-- --> --- # First few ```r plots2[[2]] ``` <!-- --> --- # First few ```r plots2[[3]] ``` ``` ## Warning: Removed 1 rows containing missing values (geom_point). ``` <!-- --> --- # Uh oh Let's get rid of our empty plots - how? Ideas? -- Create a logical vector that checks the number of rows. -- We'll do this in a moment. --- # Variants of `lapply` * `sapply` + Will try to .blue[**s**]implify the output, if possible. Otherwise it will return a list. + Fine for interactive work, but I strongly recommend against it if writing a function (difficult to predict the output) -- * `vapply` + Strict - you specify the output + Use if writing functions (or just always stick with `lapply`), or consider jumping to `{purrr}` (next week) --- # Examples ### Our simulation ```r sim_s <- sapply(seq(1, 5, by = 0.2), function(x) { rnorm(10, 0, x) }) class(sim_s) ``` ``` ## [1] "matrix" "array" ``` ```r dim(sim_s) ``` ``` ## [1] 10 21 ``` ```r sim_s ``` ``` ## [,1] [,2] [,3] [,4] [,5] [,6] [,7] ## [1,] -2.939773695 -0.38696441 -2.0067288 -0.6857975 0.26119194 -2.6882602 -5.3073906 ## [2,] 0.002415809 -1.60656089 -1.4772590 -1.0498872 -4.39616038 -3.0463115 -0.6903443 ## [3,] 0.509665571 0.82578723 -1.0263566 1.5350309 1.04457363 -0.8439364 3.6517332 ## [4,] -1.084720001 0.08553678 0.2952702 2.4896842 1.17909360 2.7218489 0.2880968 ## [5,] 0.704832977 2.62770283 -1.3984890 -1.6652743 -0.54811591 3.5075897 2.4109551 ## [6,] 0.330976350 -1.38924912 1.5089905 1.4889159 -1.27362282 3.1367295 1.0765501 ## [7,] 0.976327473 1.41802568 -1.6785641 -0.1207135 3.54882963 2.5935111 -1.7136026 ## [8,] -0.843339880 -0.63284203 0.3032918 -3.1475126 -0.16199763 -0.4751925 3.8358306 ## [9,] -0.970579905 -1.74795361 0.2003218 -1.2094458 -0.02523105 -2.4483003 -0.1724520 ## [10,] -1.771531349 0.68756084 -1.4920501 0.7378387 -2.02222249 -0.6556254 -2.1462183 ## [,8] [,9] [,10] [,11] [,12] [,13] [,14] ## [1,] 0.1695836 -1.1734150 -3.768222 -6.10501062 5.4168761 -3.3350679 -4.8069314 ## [2,] -3.6446389 2.4052205 2.894263 6.06404098 2.0548247 3.6963109 1.4332445 ## [3,] 2.0730697 -0.5164141 -2.272974 3.01792046 4.1031457 0.4737119 -0.4017125 ## [4,] 1.2037641 3.1066126 5.044831 2.45137080 0.4497503 -1.3133251 2.4326781 ## [5,] -0.8514752 1.2884162 4.960317 -1.99196485 -3.5600086 3.8201904 -2.8389526 ## [6,] -1.1722293 -5.8373967 -4.073136 -0.03384369 -1.0869663 -2.5834752 -0.3131508 ## [7,] 2.2471055 -3.4719655 -2.367832 1.85903177 -5.3272468 3.9064610 4.9762224 ## [8,] -2.5497801 3.3352155 -3.501343 -3.84371623 2.9723256 -2.8644193 0.6065646 ## [9,] -2.3611701 1.7960694 1.868407 -0.37278398 4.5338459 1.3308054 2.9634874 ## [10,] 1.0181949 -2.5143629 -3.614155 0.52722496 -0.2007065 3.0306826 -0.7952206 ## [,15] [,16] [,17] [,18] [,19] [,20] [,21] ## [1,] -3.91168829 -0.7117919 8.3144599 0.73152216 5.361125 0.7562907 -4.721494 ## [2,] -0.04151763 -1.7039254 3.3465371 -5.58623589 10.287085 4.4802659 -3.829450 ## [3,] -4.65496639 3.9866351 -7.1789600 10.33777061 1.390419 1.4535757 -4.768896 ## [4,] -9.86522328 2.9106428 -6.9874086 -6.21282379 -4.795530 -9.3895211 -1.990022 ## [5,] 4.44266585 -6.9065224 2.0626601 -0.07463057 -4.524295 1.6969762 -1.556085 ## [6,] -4.13025350 1.4135940 -0.7310330 -2.39500515 9.226305 2.1620377 3.980464 ## [7,] -6.93911545 2.9072547 4.0374204 7.92049427 -9.524629 3.1658442 4.932142 ## [8,] 3.78207087 2.6730439 1.2340720 4.45033678 14.056415 -4.9508195 -3.972658 ## [9,] -0.04507477 -9.6972692 0.3401973 -2.48035285 -1.202213 -11.3809098 -1.544090 ## [10,] -2.27858790 -0.9414297 0.7713797 0.90385150 -2.090209 -1.5579663 1.807224 ``` --- ```r sapply(penguins, is.double) ``` ``` ## species island bill_length_mm bill_depth_mm ## FALSE FALSE TRUE TRUE ## flipper_length_mm body_mass_g sex year ## FALSE FALSE FALSE FALSE ``` -- * Now that it's a vector we can easily use it for subsetting --- ```r head(penguins) ``` ``` ## # A tibble: 6 × 8 ## species island bill_length_mm bill_depth_mm flipper_length_mm body_mass_g sex ## <fct> <fct> <dbl> <dbl> <int> <int> <fct> ## 1 Adelie Torgersen 39.1 18.7 181 3750 male ## 2 Adelie Torgersen 39.5 17.4 186 3800 female ## 3 Adelie Torgersen 40.3 18 195 3250 female ## 4 Adelie Torgersen NA NA NA NA <NA> ## 5 Adelie Torgersen 36.7 19.3 193 3450 female ## 6 Adelie Torgersen 39.3 20.6 190 3650 male ## # … with 1 more variable: year <int> ``` ```r head( penguins[ ,sapply(penguins, is.double)] ) ``` ``` ## # A tibble: 6 × 2 ## bill_length_mm bill_depth_mm ## <dbl> <dbl> ## 1 39.1 18.7 ## 2 39.5 17.4 ## 3 40.3 18 ## 4 NA NA ## 5 36.7 19.3 ## 6 39.3 20.6 ``` --- # Challenge Can you make return the opposite? In other words - all those that are *not* double? <div class="countdown" id="timer_6227ceb3" style="right:0;bottom:0;" data-warnwhen="0"> <code class="countdown-time"><span class="countdown-digits minutes">02</span><span class="countdown-digits colon">:</span><span class="countdown-digits seconds">00</span></code> </div> --- ```r head( penguins[ ,!sapply(penguins, is.double)] ) ``` ``` ## # A tibble: 6 × 6 ## species island flipper_length_mm body_mass_g sex year ## <fct> <fct> <int> <int> <fct> <int> ## 1 Adelie Torgersen 181 3750 male 2007 ## 2 Adelie Torgersen 186 3800 female 2007 ## 3 Adelie Torgersen 195 3250 female 2007 ## 4 Adelie Torgersen NA NA <NA> 2007 ## 5 Adelie Torgersen 193 3450 female 2007 ## 6 Adelie Torgersen 190 3650 male 2007 ``` --- # Clean up our plots Can you recreate the plots while omitting the empty ones now? ## Try! <div class="countdown" id="timer_6227cdc8" style="right:0;bottom:0;" data-warnwhen="0"> <code class="countdown-time"><span class="countdown-digits minutes">03</span><span class="countdown-digits colon">:</span><span class="countdown-digits seconds">00</span></code> </div> --- # Remove zero-row dfs ```r # check if n rows > 0 keep <- sapply(splt2, function(x) nrow(x) > 0) keep ``` ``` ## Adelie.Biscoe Chinstrap.Biscoe Gentoo.Biscoe Adelie.Dream ## TRUE FALSE TRUE TRUE ## Chinstrap.Dream Gentoo.Dream Adelie.Torgersen Chinstrap.Torgersen ## TRUE FALSE TRUE FALSE ## Gentoo.Torgersen ## FALSE ``` ```r # Use this to subset the list splt3 <- splt2[keep] ``` --- # Recreate plots ```r plots3 <- lapply(splt3, function(x) { ggplot(x, aes(bill_length_mm, bill_depth_mm)) + geom_point() }) ``` --- # First few ```r plots3[[1]] ``` <!-- --> --- # First few ```r plots3[[2]] ``` ``` ## Warning: Removed 1 rows containing missing values (geom_point). ``` <!-- --> --- # First few ```r plots3[[3]] ``` <!-- --> --- # `vapply` * As you can probably see, simplifying can be *really* helpful for interactive work. -- .center[.blue[.realbig[BUT]]] -- * Not ideal for programmatic work - need to be able to reliably predict the output -- * `vapply` solves this issue. --- ```r vapply(mtcars, mean, FUN.VALUE = double(1)) ``` ``` ## mpg cyl disp hp drat wt qsec vs ## 20.090625 6.187500 230.721875 146.687500 3.596563 3.217250 17.848750 0.437500 ## am gear carb ## 0.406250 3.687500 2.812500 ``` ```r vapply(penguins, is.double, FUN.VALUE = character(1)) ``` ``` ## Error in vapply(penguins, is.double, FUN.VALUE = character(1)): values must be type 'character', ## but FUN(X[[1]]) result is type 'logical' ``` ```r vapply(penguins, is.double, FUN.VALUE = logical(1)) ``` ``` ## species island bill_length_mm bill_depth_mm ## FALSE FALSE TRUE TRUE ## flipper_length_mm body_mass_g sex year ## FALSE FALSE FALSE FALSE ``` --- # Coercion with `vapply` * If it can coerce the vector without loss of information, it will ```r vapply(penguins, is.double, FUN.VALUE = double(1)) ``` ``` ## species island bill_length_mm bill_depth_mm ## 0 0 1 1 ## flipper_length_mm body_mass_g sex year ## 0 0 0 0 ``` --- # Count missing data ```r vapply(airquality, function(col) { sum(is.na(col)) }, FUN.VALUE = double(1) ) ``` ``` ## Ozone Solar.R Wind Temp Month Day ## 37 7 0 0 0 0 ``` --- # `sapply` alternative For interactive work, the code on the previous slide is maybe too much. Could be reduced to ```r sapply(airquality, function(col) sum(is.na(col))) ``` ``` ## Ozone Solar.R Wind Temp Month Day ## 37 7 0 0 0 0 ``` --- # Summary * `for` loops are incredibly flexible and there's nothing inherently "wrong" about them -- + Do require more text, and often repetitive text, which can lead to errors/bugs -- + The flexibility can actually be more of a curse than a blessing --- # Summary * The `lapply` family of functions help put the focus on a given function, and what values are being looped through the function -- + `lapply` will always return a list -- + `sapply` will try to simplify, which is problematic for programming, but fine for interactive work -- + `vapply` is strict, and will only return the type specified --- class: inverse-red middle # apply ### Quickly --- class: middle # `apply(x, dimension, function, function_args)` * `x` The thing to loop over (usually a matrix or data frame) * `dimension` + `1` = apply the function to each row + `2` = apply the function to each column + `n` = apply to `\(n\)`th dimension of an array (rare for the work I do) --- # Rows example ```r people <- data.frame( first = c("Frederick", "Anna", "Julia"), last = c("Douglass", "Murray", "Griffiths") ) people ``` ``` ## first last ## 1 Frederick Douglass ## 2 Anna Murray ## 3 Julia Griffiths ``` Suppose we wanted a new column that was the first and last name. --- We might try this ```r people %>% mutate(full_name = paste(first, last, collapse = " ")) ``` ``` ## first last full_name ## 1 Frederick Douglass Frederick Douglass Anna Murray Julia Griffiths ## 2 Anna Murray Frederick Douglass Anna Murray Julia Griffiths ## 3 Julia Griffiths Frederick Douglass Anna Murray Julia Griffiths ``` ... but it pastes together the full columns --- Instead, do it by row ```r apply(people, 1, paste, collapse = " ") ``` ``` ## [1] "Frederick Douglass" "Anna Murray" "Julia Griffiths" ``` -- Or within a `mutate()` call ```r people %>% mutate(full_name = apply(people, 1, paste, collapse = " ")) ``` ``` ## first last full_name ## 1 Frederick Douglass Frederick Douglass ## 2 Anna Murray Anna Murray ## 3 Julia Griffiths Julia Griffiths ``` --- # Column example Back to the airquality example - standardize all columns. Notice it returns a matrix though, which is less than ideal. ```r apply(airquality, 2, function(x) { as.numeric(scale(x)) }) ``` ``` ## Ozone Solar.R Wind Temp Month Day ## [1,] -0.03423409 0.0451761540 -0.72594816 -1.14971398 -1.40729432 -1.67001947 ## [2,] -0.18580489 -0.7543048742 -0.55563883 -0.62146702 -1.40729432 -1.55721020 ## [3,] -0.91334473 -0.4100838759 0.75006604 -0.41016823 -1.40729432 -1.44440094 ## [4,] -0.73145977 1.4109562438 0.43783226 -1.67796094 -1.40729432 -1.33159168 ## [5,] NA NA 1.23260914 -2.31185730 -1.40729432 -1.21878242 ## [6,] -0.42831817 NA 1.40291847 -1.25536337 -1.40729432 -1.10597316 ## [7,] -0.57988897 1.2555015994 -0.38532950 -1.36101276 -1.40729432 -0.99316389 ## [8,] -0.70114561 -0.9652790344 1.09068470 -1.99490912 -1.40729432 -0.88035463 ## [9,] -1.03460136 -1.8535912880 2.87893266 -1.78361034 -1.40729432 -0.76754537 ## [10,] NA 0.0895917667 -0.38532950 -0.93841519 -1.40729432 -0.65473611 ## [11,] -1.06491552 NA -0.86787260 -0.41016823 -1.40729432 -0.54192685 ## [12,] -0.79208809 0.7780337632 -0.07309573 -0.93841519 -1.40729432 -0.42911758 ## [13,] -0.94365889 1.1555664709 -0.21502017 -1.25536337 -1.40729432 -0.31630832 ## [14,] -0.85271641 0.9779040202 0.26752293 -1.04406459 -1.40729432 -0.20349906 ## [15,] -0.73145977 -1.3428117422 0.92037537 -2.10055851 -1.40729432 -0.09068980 ## [16,] -0.85271641 1.6441382104 0.43783226 -1.46666216 -1.40729432 0.02211946 ## [17,] -0.24643321 1.3443328248 0.57975671 -1.25536337 -1.40729432 0.13492873 ## [18,] -1.09522968 -1.1984610010 2.39638956 -2.20620791 -1.40729432 0.24773799 ## [19,] -0.36768985 1.5108913723 0.43783226 -1.04406459 -1.40729432 0.36054725 ## [20,] -0.94365889 -1.5759937087 -0.07309573 -1.67796094 -1.40729432 0.47335651 ## [21,] -1.24680048 -1.9757342228 -0.07309573 -1.99490912 -1.40729432 0.58616577 ## [22,] -0.94365889 1.4886835660 1.88546157 -0.51581762 -1.40729432 0.69897503 ## [23,] -1.15585800 -1.7869678689 -0.07309573 -1.78361034 -1.40729432 0.81178430 ## [24,] -0.30706153 -1.0430063566 0.57975671 -1.78361034 -1.40729432 0.92459356 ## [25,] NA -1.3317078390 1.88546157 -2.20620791 -1.40729432 1.03740282 ## [26,] NA 0.8890727949 1.40291847 -2.10055851 -1.40729432 1.15021208 ## [27,] NA NA -0.55563883 -2.20620791 -1.40729432 1.26302134 ## [28,] -0.57988897 -1.9202147070 0.57975671 -1.14971398 -1.40729432 1.37583061 ## [29,] 0.08702254 0.7336181505 1.40291847 0.32937752 -1.40729432 1.48863987 ## [30,] 2.20901373 0.4116049586 -1.20849126 0.11807873 -1.40729432 1.60144913 ## [31,] -0.15549073 1.0334235361 -0.72594816 -0.19886945 -1.40729432 1.71425839 ## [32,] NA 1.1111508582 -0.38532950 0.01242934 -0.70134012 -1.67001947 ## [33,] NA 1.1222547614 -0.07309573 -0.41016823 -0.70134012 -1.55721020 ## [34,] NA 0.6225791188 1.74353713 -1.14971398 -0.70134012 -1.44440094 ## [35,] NA 0.0007605413 -0.21502017 0.64632570 -0.70134012 -1.33159168 ## [36,] NA 0.3782932491 -0.38532950 0.75197509 -0.70134012 -1.21878242 ## [37,] NA 0.8668649885 1.23260914 0.11807873 -0.70134012 -1.10597316 ## [38,] -0.39800401 -0.6543697457 -0.07309573 0.43502691 -0.70134012 -0.99316389 ## [39,] NA 0.9668001170 -0.86787260 0.96327387 -0.70134012 -0.88035463 ## [40,] 0.87519070 1.1666703741 1.09068470 1.28022205 -0.70134012 -0.76754537 ## [41,] -0.09486241 1.5219952755 0.43783226 0.96327387 -0.70134012 -0.65473611 ## [42,] NA 0.8113454727 0.26752293 1.59717023 -0.70134012 -0.54192685 ## [43,] NA 0.7114103441 -0.21502017 1.49152084 -0.70134012 -0.42911758 ## [44,] -0.57988897 -0.4211877791 -0.55563883 0.43502691 -0.70134012 -0.31630832 ## [45,] NA 1.6219304040 1.09068470 0.22372813 -0.70134012 -0.20349906 ## [46,] NA 1.5108913723 0.43783226 0.11807873 -0.70134012 -0.09068980 ## [47,] -0.64051729 0.0562800572 1.40291847 -0.09322005 -0.70134012 0.02211946 ## [48,] -0.15549073 1.0889430519 3.04924199 -0.62146702 -0.70134012 0.13492873 ## [49,] -0.67083145 -1.6537210309 -0.21502017 -1.36101276 -0.70134012 0.24773799 ## [50,] -0.91334473 -0.7320970679 0.43783226 -0.51581762 -0.70134012 0.36054725 ## [51,] -0.88303057 -0.5433307140 0.09721360 -0.19886945 -0.70134012 0.47335651 ## [52,] NA -0.3989799728 -1.03818193 -0.09322005 -0.70134012 0.58616577 ## [53,] NA -1.4094351612 -2.34388679 -0.19886945 -0.70134012 0.69897503 ## [54,] NA -1.0541102598 -1.52072503 -0.19886945 -0.70134012 0.81178430 ## [55,] NA 0.7114103441 -1.03818193 -0.19886945 -0.70134012 0.92459356 ## [56,] NA -0.5655385203 -0.55563883 -0.30451884 -0.70134012 1.03740282 ## [57,] NA -0.6543697457 -0.55563883 0.01242934 -0.70134012 1.15021208 ## [58,] NA -1.5426819992 0.09721360 -0.51581762 -0.70134012 1.26302134 ## [59,] NA -0.9763829376 0.43783226 0.22372813 -0.70134012 1.37583061 ## [60,] NA -1.7203444499 1.40291847 -0.09322005 -0.70134012 1.48863987 ## [61,] NA -0.5322268108 -0.55563883 0.54067630 -0.70134012 1.60144913 ## [62,] 2.81529692 0.9223845044 -1.66264947 0.64632570 0.00461408 -1.67001947 ## [63,] 0.20827918 0.6892025378 -0.21502017 0.75197509 0.00461408 -1.55721020 ## [64,] -0.30706153 0.5559556998 -0.21502017 0.32937752 0.00461408 -1.44440094 ## [65,] NA -0.9430712281 0.26752293 0.64632570 0.00461408 -1.33159168 ## [66,] 0.66299158 -0.1213823935 -1.52072503 0.54067630 0.00461408 -1.21878242 ## [67,] -0.06454825 1.4220601470 0.26752293 0.54067630 0.00461408 -1.10597316 ## [68,] 1.05707566 1.0001118265 -1.37880059 1.06892327 0.00461408 -0.99316389 ## [69,] 1.66335885 0.9001766980 -1.03818193 1.49152084 0.00461408 -0.88035463 ## [70,] 1.66335885 0.9556962139 -1.20849126 1.49152084 0.00461408 -0.76754537 ## [71,] 1.29958893 -0.1213823935 -0.72594816 1.17457266 0.00461408 -0.65473611 ## [72,] NA -0.5211229076 -0.38532950 0.43502691 0.00461408 -0.54192685 ## [73,] -0.97397305 0.8668649885 1.23260914 -0.51581762 0.00461408 -0.42911758 ## [74,] -0.45863233 -0.1213823935 1.40291847 0.32937752 0.00461408 -0.31630832 ## [75,] NA 1.1666703741 1.40291847 1.38587145 0.00461408 -0.20349906 ## [76,] -1.06491552 -1.5315780960 1.23260914 0.22372813 0.00461408 -0.09068980 ## [77,] 0.17796502 0.8224493758 -0.86787260 0.32937752 0.00461408 0.02211946 ## [78,] -0.21611905 0.9779040202 0.09721360 0.43502691 0.00461408 0.13492873 ## [79,] 0.57204910 1.1000469551 -1.03818193 0.64632570 0.00461408 0.24773799 ## [80,] 1.11770398 0.0118644445 -1.37880059 0.96327387 0.00461408 0.36054725 ## [81,] 0.63267742 0.3782932491 0.43783226 0.75197509 0.00461408 0.47335651 ## [82,] -0.79208809 -1.9868381260 -0.86787260 -0.41016823 0.00461408 0.58616577 ## [83,] NA 0.8002415695 -0.07309573 0.32937752 0.00461408 0.69897503 ## [84,] NA 1.2110859868 0.43783226 0.43502691 0.00461408 0.81178430 ## [85,] 1.14801813 1.1999820836 -0.38532950 0.85762448 0.00461408 0.92459356 ## [86,] 1.99681461 0.4116049586 -0.55563883 0.75197509 0.00461408 1.03740282 ## [87,] -0.67083145 -1.1651492915 -0.38532950 0.43502691 0.00461408 1.15021208 ## [88,] 0.29922166 -1.1540453883 0.57975671 0.85762448 0.00461408 1.26302134 ## [89,] 1.20864645 0.3005659269 -0.72594816 1.06892327 0.00461408 1.37583061 ## [90,] 0.23859334 0.9890079234 -0.72594816 0.85762448 0.00461408 1.48863987 ## [91,] 0.66299158 0.7447220537 -0.72594816 0.54067630 0.00461408 1.60144913 ## [92,] 0.51142078 0.7558259568 -0.21502017 0.32937752 0.00461408 1.71425839 ## [93,] -0.09486241 -1.1429414851 -0.86787260 0.32937752 0.71056828 -1.67001947 ## [94,] -1.00428721 -1.7980717721 1.09068470 0.32937752 0.71056828 -1.55721020 ## [95,] -0.79208809 -1.2095649041 -0.72594816 0.43502691 0.71056828 -1.44440094 ## [96,] 1.08738982 NA -0.86787260 0.85762448 0.71056828 -1.33159168 ## [97,] -0.21611905 NA -0.72594816 0.75197509 0.71056828 -1.21878242 ## [98,] 0.72361990 NA -1.52072503 0.96327387 0.71056828 -1.10597316 ## [99,] 2.42121284 0.7669298600 -1.69103436 1.17457266 0.71056828 -0.99316389 ## [100,] 1.42084557 0.4782283776 0.09721360 1.28022205 0.71056828 -0.88035463 ## [101,] 2.05744293 0.2339425079 -0.55563883 1.28022205 0.71056828 -0.76754537 ## [102,] NA 0.4005010554 -0.38532950 1.49152084 0.71056828 -0.65473611 ## [103,] NA -0.5433307140 0.43783226 0.85762448 0.71056828 -0.54192685 ## [104,] 0.05670838 0.0673839603 0.43783226 0.85762448 0.71056828 -0.42911758 ## [105,] -0.42831817 0.9668001170 0.43783226 0.43502691 0.71056828 -0.31630832 ## [106,] 0.69330574 -0.3212526506 -0.07309573 0.22372813 0.71056828 -0.20349906 ## [107,] NA -1.3539156453 0.43783226 0.11807873 0.71056828 -0.09068980 ## [108,] -0.61020313 -1.2761883232 0.09721360 -0.09322005 0.71056828 0.02211946 ## [109,] 0.51142078 -1.4982663865 -1.03818193 0.11807873 0.71056828 0.13492873 ## [110,] -0.57988897 -0.7876165837 -0.72594816 -0.19886945 0.71056828 0.24773799 ## [111,] -0.33737569 0.6447869251 0.26752293 0.01242934 0.71056828 0.36054725 ## [112,] 0.05670838 0.0451761540 0.09721360 0.01242934 0.71056828 0.47335651 ## [113,] -0.64051729 0.8113454727 1.57322780 -0.09322005 0.71056828 0.58616577 ## [114,] -1.00428721 -1.6648249341 1.23260914 -0.62146702 0.71056828 0.69897503 ## [115,] NA 0.7669298600 0.75006604 -0.30451884 0.71056828 0.81178430 ## [116,] 0.08702254 0.2894620237 -0.07309573 0.11807873 0.71056828 0.92459356 ## [117,] 3.81566419 0.5781635061 -1.86134369 0.32937752 0.71056828 1.03740282 ## [118,] 0.93581902 0.3227737332 -0.55563883 0.85762448 0.71056828 1.15021208 ## [119,] NA -0.3656682633 -1.20849126 1.06892327 0.71056828 1.26302134 ## [120,] 1.02676150 0.1895268952 -0.07309573 2.01976780 0.71056828 1.37583061 ## [121,] 2.29995620 0.4338127649 -2.17357746 1.70281962 0.71056828 1.48863987 ## [122,] 1.26927477 0.5670596029 -1.03818193 1.91411841 0.71056828 1.60144913 ## [123,] 1.29958893 0.0229683477 -1.03818193 1.70281962 0.71056828 1.71425839 ## [124,] 1.63304469 -0.2102136189 -0.86787260 1.38587145 1.41652248 -1.67001947 ## [125,] 1.08738982 0.1229034762 -1.37880059 1.49152084 1.41652248 -1.55721020 ## [126,] 0.93581902 -0.0325511682 -2.03165302 1.59717023 1.41652248 -1.44440094 ## [127,] 1.48147389 0.0340722508 -1.52072503 1.59717023 1.41652248 -1.33159168 ## [128,] 0.14765086 -1.0096946471 -0.72594816 0.96327387 1.41652248 -1.21878242 ## [129,] -0.30706153 -1.0430063566 1.57322780 0.64632570 1.41652248 -1.10597316 ## [130,] -0.67083145 0.7336181505 0.26752293 0.22372813 1.41652248 -0.99316389 ## [131,] -0.57988897 0.3782932491 0.09721360 0.01242934 1.41652248 -0.88035463 ## [132,] -0.64051729 0.4893322808 0.26752293 -0.30451884 1.41652248 -0.76754537 ## [133,] -0.54957481 0.8113454727 -0.07309573 -0.51581762 1.41652248 -0.65473611 ## [134,] 0.05670838 0.5559556998 1.40291847 0.32937752 1.41652248 -0.54192685 ## [135,] -0.64051729 0.8113454727 1.57322780 -0.19886945 1.41652248 -0.42911758 ## [136,] -0.42831817 0.5781635061 -1.03818193 -0.09322005 1.41652248 -0.31630832 ## [137,] -1.00428721 -1.7980717721 0.26752293 -0.72711641 1.41652248 -0.20349906 ## [138,] -0.88303057 -0.8209282932 0.43783226 -0.72711641 1.41652248 -0.09068980 ## [139,] 0.11733670 0.5670596029 -0.86787260 0.01242934 1.41652248 0.02211946 ## [140,] -0.73145977 0.4227088617 1.09068470 -1.14971398 1.41652248 0.13492873 ## [141,] -0.88303057 -1.7647600626 0.09721360 -0.19886945 1.41652248 0.24773799 ## [142,] -0.54957481 0.5781635061 0.09721360 -1.04406459 1.41652248 0.36054725 ## [143,] -0.79208809 0.1673190889 -0.55563883 0.43502691 1.41652248 0.47335651 ## [144,] -0.88303057 0.5781635061 0.75006604 -1.46666216 1.41652248 0.58616577 ## [145,] -0.57988897 -1.9091108038 -0.21502017 -0.72711641 1.41652248 0.69897503 ## [146,] -0.18580489 -0.5211229076 0.09721360 0.32937752 1.41652248 0.81178430 ## [147,] -1.06491552 -1.5204741929 0.09721360 -0.93841519 1.41652248 0.92459356 ## [148,] -0.85271641 -1.8424873848 1.88546157 -1.57231155 1.41652248 1.03740282 ## [149,] -0.36768985 0.0784878635 -0.86787260 -0.83276580 1.41652248 1.15021208 ## [150,] NA -0.4544994886 0.92037537 -0.09322005 1.41652248 1.26302134 ## [151,] -0.85271641 0.0562800572 1.23260914 -0.30451884 1.41652248 1.37583061 ## [152,] -0.73145977 -0.6099541330 -0.55563883 -0.19886945 1.41652248 1.48863987 ## [153,] -0.67083145 0.4116049586 0.43783226 -1.04406459 1.41652248 1.60144913 ``` --- # Last bit There are other loops, like `tapply()`, but I tend to not use them much (instead just use `lapply(split(x)`). All of this stuff takes practice, both to understand how it works and to start to see use cases Careful not to get into too deep of nested loops - if you're nesting beyond two levels (and I honestly never go beyond one anymore) there's probably better ways to approach it. --- class: inverse-green middle # Lab 1