class: center, middle, inverse, title-slide # Intro to {purrr} ## And a more explicit description of functional programming ### Daniel Anderson ### Week 3 --- layout: true <script> feather.replace() </script> <div class="slides-footer"> <span> <a class = "footer-icon-link" href = "https://github.com/uo-datasci-specialization/c3-fp-2022/raw/main/static/slides/w3.pdf"> <i class = "footer-icon" data-feather="download"></i> </a> <a class = "footer-icon-link" href = "https://fp-2022.netlify.app/slides/w3.html"> <i class = "footer-icon" data-feather="link"></i> </a> <a class = "footer-icon-link" href = "https://fp-2022.netlify.app/"> <i class = "footer-icon" data-feather="globe"></i> </a> <a class = "footer-icon-link" href = "https://github.com/uo-datasci-specialization/c3-fp-2022"> <i class = "footer-icon" data-feather="github"></i> </a> </span> </div> --- # Agenda * Review Lab 1 * Thinking more about functional programming + A small example * Introduce you to {purrr} and contrast it with the base functions we learned last week --- class: inverse-red middle # Review Lab 1 --- # Learning objectives * Understand how `purrr::map` relates to `lapply` and `for` loops * Understand the four basic variants of `purrr::map`, when they should be used, and when they will fail * Understand what functional programming is, and how `{purrr}` can help facilitate the process --- class: inverse-blue middle # Functional Programming --- # What is FP? > decomposing a big problem into smaller pieces, then solving each piece with a function or combination of functions \- [Adv-R](https://adv-r.hadley.nz/fp.html) --- # Example ### Calculate top mpg manufactures * First, we'll subset the data to 4 cylinders. This will be the dataset we'll solve the problem on: ```r library(tidyverse) four_cyl <- filter(mpg, cyl == 4) ``` --- * Next, we'll filter for cases where the city miles per gallon is in the top 10% (i.e.,greater than or equal to the 90th percentile). ```r ninety <- four_cyl %>% filter(cty >= quantile(cty, probs = 0.9)) ninety ``` ``` ## # A tibble: 10 × 11 ## manufacturer model displ year cyl trans drv cty hwy fl ## <chr> <chr> <dbl> <int> <int> <chr> <chr> <int> <int> <chr> ## 1 honda civic 1.6 1999 4 manual(m5) f 28 33 r ## 2 honda civic 1.6 1999 4 manual(m5) f 25 32 r ## 3 honda civic 1.8 2008 4 manual(m5) f 26 34 r ## 4 honda civic 1.8 2008 4 auto(l5) f 25 36 r ## 5 toyota corolla 1.8 1999 4 manual(m5) f 26 35 r ## 6 toyota corolla 1.8 2008 4 manual(m5) f 28 37 r ## 7 toyota corolla 1.8 2008 4 auto(l4) f 26 35 r ## 8 volkswagen jetta 1.9 1999 4 manual(m5) f 33 44 d ## 9 volkswagen new beetle 1.9 1999 4 manual(m5) f 35 44 d ## 10 volkswagen new beetle 1.9 1999 4 auto(l4) f 29 41 d ## # … with 1 more variable: class <chr> ``` --- * Now count the unique occurrences for each manufacturer, manufacturer/model, and class ```r count_mfr <- count(ninety, manufacturer) count_model <- count(ninety, manufacturer, model) count_class <- count(ninety, class) ``` --- * Produce a plot for each ```r plot_mfr <- ggplot(count_mfr, aes(fct_reorder(manufacturer, -n), n)) + geom_col(aes(fill = manufacturer)) + scale_fill_brewer(palette = "Set3") + labs(title = "Manufacturers", x = "", y = "") + guides(fill = "none") plot_car <- count_model %>% unite(car, manufacturer, model, sep = " ") %>% ggplot(aes(fct_reorder(car, -n), n)) + geom_col(aes(fill = car)) + scale_fill_brewer(palette = "Set3") + labs(title = "Top 10% of city mpg", subtitle = "Car frequency", x = "", y = "") + guides(fill = "none") ``` --- ```r plot_class <- ggplot(count_class, aes(fct_reorder(class, -n), n)) + geom_col(aes(fill = class)) + scale_fill_brewer(palette = "Set3") + labs(title = "Car Class", x = "", y = "") + guides(fill = "none") ``` --- # Assemble the plots ```r library(patchwork) plot_car / (plot_mfr + plot_class) ``` 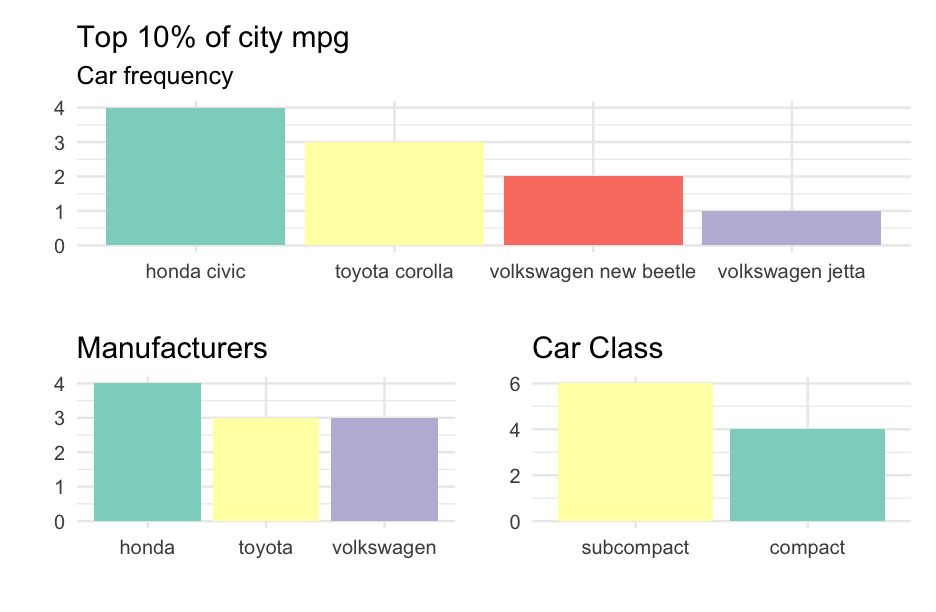<!-- --> --- class: inverse-red middle # Functional Programming Version ### At least in spirit --- # Filter all ```r by_cyl <- split(mpg, mpg$cyl) top_10 <- lapply(by_cyl, function(x) { filter(x, cty >= quantile(cty, probs = 0.9)) }) str(top_10) ``` ``` ## List of 4 ## $ 4: tibble [10 × 11] (S3: tbl_df/tbl/data.frame) ## ..$ manufacturer: chr [1:10] "honda" "honda" "honda" "honda" ... ## ..$ model : chr [1:10] "civic" "civic" "civic" "civic" ... ## ..$ displ : num [1:10] 1.6 1.6 1.8 1.8 1.8 1.8 1.8 1.9 1.9 1.9 ## ..$ year : int [1:10] 1999 1999 2008 2008 1999 2008 2008 1999 1999 1999 ## ..$ cyl : int [1:10] 4 4 4 4 4 4 4 4 4 4 ## ..$ trans : chr [1:10] "manual(m5)" "manual(m5)" "manual(m5)" "auto(l5)" ... ## ..$ drv : chr [1:10] "f" "f" "f" "f" ... ## ..$ cty : int [1:10] 28 25 26 25 26 28 26 33 35 29 ## ..$ hwy : int [1:10] 33 32 34 36 35 37 35 44 44 41 ## ..$ fl : chr [1:10] "r" "r" "r" "r" ... ## ..$ class : chr [1:10] "subcompact" "subcompact" "subcompact" "subcompact" ... ## $ 5: tibble [2 × 11] (S3: tbl_df/tbl/data.frame) ## ..$ manufacturer: chr [1:2] "volkswagen" "volkswagen" ## ..$ model : chr [1:2] "jetta" "jetta" ## ..$ displ : num [1:2] 2.5 2.5 ## ..$ year : int [1:2] 2008 2008 ## ..$ cyl : int [1:2] 5 5 ## ..$ trans : chr [1:2] "auto(s6)" "manual(m5)" ## ..$ drv : chr [1:2] "f" "f" ## ..$ cty : int [1:2] 21 21 ## ..$ hwy : int [1:2] 29 29 ## ..$ fl : chr [1:2] "r" "r" ## ..$ class : chr [1:2] "compact" "compact" ## $ 6: tibble [23 × 11] (S3: tbl_df/tbl/data.frame) ## ..$ manufacturer: chr [1:23] "audi" "audi" "chevrolet" "chevrolet" ... ## ..$ model : chr [1:23] "a4" "a4" "malibu" "malibu" ... ## ..$ displ : num [1:23] 2.8 3.1 3.1 3.5 3.8 3.8 2.5 2.5 3.3 3.5 ... ## ..$ year : int [1:23] 1999 2008 1999 2008 1999 1999 1999 1999 2008 2008 ... ## ..$ cyl : int [1:23] 6 6 6 6 6 6 6 6 6 6 ... ## ..$ trans : chr [1:23] "manual(m5)" "auto(av)" "auto(l4)" "auto(l4)" ... ## ..$ drv : chr [1:23] "f" "f" "f" "f" ... ## ..$ cty : int [1:23] 18 18 18 18 18 18 18 18 19 19 ... ## ..$ hwy : int [1:23] 26 27 26 29 26 25 26 26 28 27 ... ## ..$ fl : chr [1:23] "p" "p" "r" "r" ... ## ..$ class : chr [1:23] "compact" "compact" "midsize" "midsize" ... ## $ 8: tibble [11 × 11] (S3: tbl_df/tbl/data.frame) ## ..$ manufacturer: chr [1:11] "audi" "chevrolet" "chevrolet" "chevrolet" ... ## ..$ model : chr [1:11] "a6 quattro" "corvette" "corvette" "corvette" ... ## ..$ displ : num [1:11] 4.2 5.7 5.7 6.2 6.2 7 4.6 4.6 4.6 4.6 ... ## ..$ year : int [1:11] 2008 1999 1999 2008 2008 2008 1999 1999 2008 2008 ... ## ..$ cyl : int [1:11] 8 8 8 8 8 8 8 8 8 8 ... ## ..$ trans : chr [1:11] "auto(s6)" "manual(m6)" "auto(l4)" "manual(m6)" ... ## ..$ drv : chr [1:11] "4" "r" "r" "r" ... ## ..$ cty : int [1:11] 16 16 15 16 15 15 15 15 15 15 ... ## ..$ hwy : int [1:11] 23 26 23 26 25 24 21 22 23 22 ... ## ..$ fl : chr [1:11] "p" "p" "p" "p" ... ## ..$ class : chr [1:11] "midsize" "2seater" "2seater" "2seater" ... ``` --- # All counts ```r counts <- lapply(top_10, function(x) { count_manufacturer <- count(x, manufacturer) count_class <- count(x, class) count_model <- count(x, manufacturer, model) %>% unite(car, manufacturer, model, sep = " ") return(list(mfr = count_manufacturer, car = count_model, class = count_class)) }) counts ``` ``` ## $`4` ## $`4`$mfr ## # A tibble: 3 × 2 ## manufacturer n ## <chr> <int> ## 1 honda 4 ## 2 toyota 3 ## 3 volkswagen 3 ## ## $`4`$car ## # A tibble: 4 × 2 ## car n ## <chr> <int> ## 1 honda civic 4 ## 2 toyota corolla 3 ## 3 volkswagen jetta 1 ## 4 volkswagen new beetle 2 ## ## $`4`$class ## # A tibble: 2 × 2 ## class n ## <chr> <int> ## 1 compact 4 ## 2 subcompact 6 ## ## ## $`5` ## $`5`$mfr ## # A tibble: 1 × 2 ## manufacturer n ## <chr> <int> ## 1 volkswagen 2 ## ## $`5`$car ## # A tibble: 1 × 2 ## car n ## <chr> <int> ## 1 volkswagen jetta 2 ## ## $`5`$class ## # A tibble: 1 × 2 ## class n ## <chr> <int> ## 1 compact 2 ## ## ## $`6` ## $`6`$mfr ## # A tibble: 8 × 2 ## manufacturer n ## <chr> <int> ## 1 audi 2 ## 2 chevrolet 2 ## 3 ford 2 ## 4 hyundai 3 ## 5 nissan 5 ## 6 pontiac 2 ## 7 toyota 6 ## 8 volkswagen 1 ## ## $`6`$car ## # A tibble: 10 × 2 ## car n ## <chr> <int> ## 1 audi a4 2 ## 2 chevrolet malibu 2 ## 3 ford mustang 2 ## 4 hyundai sonata 3 ## 5 nissan altima 2 ## 6 nissan maxima 3 ## 7 pontiac grand prix 2 ## 8 toyota camry 3 ## 9 toyota camry solara 3 ## 10 volkswagen passat 1 ## ## $`6`$class ## # A tibble: 3 × 2 ## class n ## <chr> <int> ## 1 compact 5 ## 2 midsize 16 ## 3 subcompact 2 ## ## ## $`8` ## $`8`$mfr ## # A tibble: 4 × 2 ## manufacturer n ## <chr> <int> ## 1 audi 1 ## 2 chevrolet 5 ## 3 ford 4 ## 4 pontiac 1 ## ## $`8`$car ## # A tibble: 4 × 2 ## car n ## <chr> <int> ## 1 audi a6 quattro 1 ## 2 chevrolet corvette 5 ## 3 ford mustang 4 ## 4 pontiac grand prix 1 ## ## $`8`$class ## # A tibble: 3 × 2 ## class n ## <chr> <int> ## 1 2seater 5 ## 2 midsize 2 ## 3 subcompact 4 ``` --- # Plots ### Let's write a couple functions We'll mostly ignore how for now. ```r counts_plot <- function(counts_df) { var <- names(counts_df)[1] p <- ggplot(counts_df, aes(fct_reorder(!!sym(var), -n), n)) + geom_col(aes(fill = !!sym(var))) + scale_fill_brewer(palette = "Set3") + labs(title = stringr::str_to_title(var), x = "", y = "") + guides(fill = "none") if(var == "car") { p <- p + labs(title = "Top 10% of city mpg", subtitle = var) } p } ``` --- # Test it ```r counts_plot(counts[["4"]]$mfr) ``` 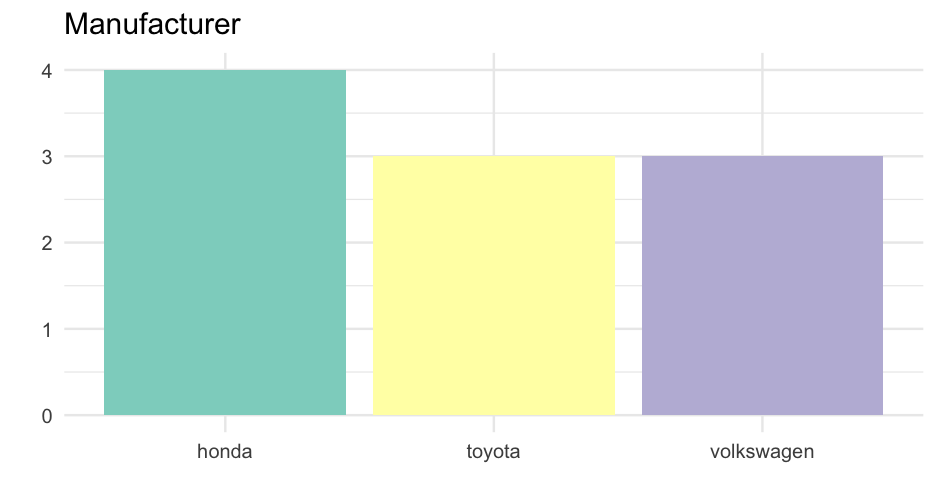<!-- --> --- ```r counts_plot(counts[["8"]]$car) ``` 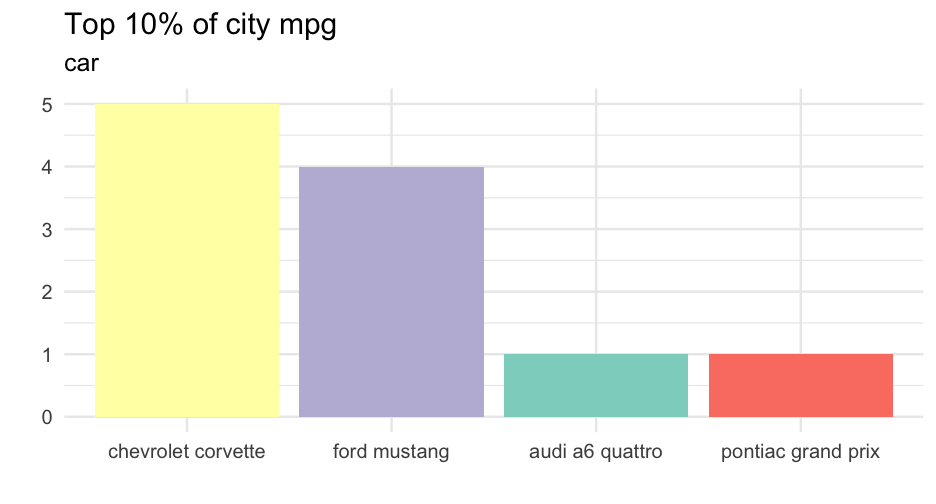<!-- --> --- ```r counts_plot(counts[["6"]]$class) ``` 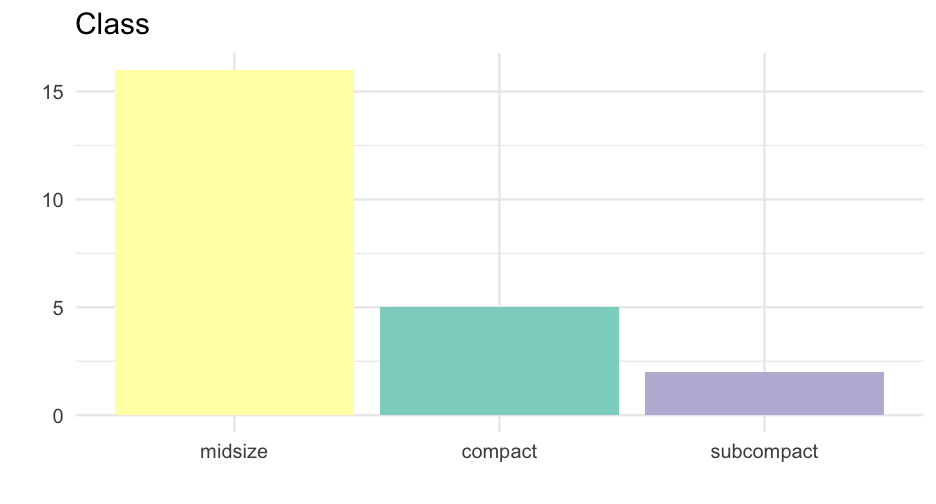<!-- --> --- # Compile plots function ```r full_plot <- function(l) { counts_plot(l[["car"]]) / ( counts_plot(l[["mfr"]]) + counts_plot(l[["class"]]) ) } ``` --- # Test it ```r full_plot(counts[[1]]) ``` <!-- --> --- # Finish up ```r plots <- lapply(counts, full_plot) ``` --- ```r plots[[1]] ``` <!-- --> --- ```r plots[[2]] ``` <!-- --> --- ```r plots[[3]] ``` <!-- --> --- ```r plots[[4]] ``` <!-- --> --- class: inverse-blue middle # {purrr} --- # functionals > a function that takes a function as input and returns a vector as output. - What does this mean? --- # `purrr::map` ```r library(purrr) # loaded automatically by tidyverse map(1:3, rnorm) ``` ``` ## [[1]] ## [1] -0.443447 ## ## [[2]] ## [1] -1.0505721 -0.3394564 ## ## [[3]] ## [1] -0.4678440 0.1258665 1.0731389 ``` --- background-image:url(https://d33wubrfki0l68.cloudfront.net/f0494d020aa517ae7b1011cea4c4a9f21702df8b/2577b/diagrams/functionals/map.png) background-size:contain # Graphically --- # Comparison to `base::lapply` .pull-left[ ### lapply ```r lapply(1:3, rnorm) ``` ``` ## [[1]] ## [1] 0.5279669 ## ## [[2]] ## [1] -0.924577 -1.766093 ## ## [[3]] ## [1] -0.8753488 0.4032877 -0.2509193 ``` ] .pull-right[ ### map ```r map(1:3, rnorm) ``` ``` ## [[1]] ## [1] 0.8399047 ## ## [[2]] ## [1] -1.411129 1.268880 ## ## [[3]] ## [1] -1.5068100 1.0414819 0.2418696 ``` ] side note: What exactly is going on here? --- > The base equivalent to `map()` is `lapply()`. The only difference is that `lapply()` does not support the helpers that you’ll learn about (next), so if you’re only using `map()` from {purrr}, you can skip the additional dependency and use `lapply()` directly. \- [Adv R](https://adv-r.hadley.nz/functionals.html) --- # Equivalents The following are equivalent ```r map(mtcars, function(x) length(unique(x))) lapply(mtcars, function(x) length(unique(x))) ``` -- {purrr} also allows you to specify anonymous functions more succinctly using the formula interface ```r map(mtcars, ~length(unique(.x))) ``` ``` ## $mpg ## [1] 25 ## ## $cyl ## [1] 3 ## ## $disp ## [1] 27 ## ## $hp ## [1] 22 ## ## $drat ## [1] 22 ## ## $wt ## [1] 29 ## ## $qsec ## [1] 30 ## ## $vs ## [1] 2 ## ## $am ## [1] 2 ## ## $gear ## [1] 3 ## ## $carb ## [1] 6 ``` --- class: inverse-white middle # `~` is used in place of `function(.x)` --- # More examples .pull-left[ ### Vary the `n` ```r map(1:3, ~rnorm(n = .x)) ``` ``` ## [[1]] ## [1] 0.9697506 ## ## [[2]] ## [1] 0.9260836 -0.8879916 ## ## [[3]] ## [1] -0.9369674 1.0084796 -0.2488219 ``` ] .pull-right[ ### Vary the `mean` ```r map(1:3, ~rnorm(n = 1, mean = .x)) ``` ``` ## [[1]] ## [1] 0.9968307 ## ## [[2]] ## [1] 4.104241 ## ## [[3]] ## [1] 3.887219 ``` ] --- ### vary the `sd` ```r map(1:3, ~rnorm(n = 1, sd = .x)) ``` ``` ## [[1]] ## [1] -1.040311 ## ## [[2]] ## [1] -2.498778 ## ## [[3]] ## [1] 0.5607935 ``` --- # Extracting elements Let's make a rather complicated list ```r l <- list( list(-1, x = 1, y = 2, z = "a"), list(-2, x = 4, y = c(5, 6), z = "b"), list(-3, x = 8, y = c(9, 10, 11)) ) ``` -- ### Extract second element from each ```r map(l, 2) ``` ``` ## [[1]] ## [1] 1 ## ## [[2]] ## [1] 4 ## ## [[3]] ## [1] 8 ``` --- ### Doesn't work for `lapply` ```r lapply(l, 2) ``` ``` ## Error in match.fun(FUN): '2' is not a function, character or symbol ``` -- Instead, you have to apply an anonymous function ```r lapply(l, function(x) x[[2]]) ``` ``` ## [[1]] ## [1] 1 ## ## [[2]] ## [1] 4 ## ## [[3]] ## [1] 8 ``` --- Alternatively the following is also the same ```r lapply(l, `[[`, 2) ``` ``` ## [[1]] ## [1] 1 ## ## [[2]] ## [1] 4 ## ## [[3]] ## [1] 8 ``` --- # Extract by name ```r map(l, "y") ``` ``` ## [[1]] ## [1] 2 ## ## [[2]] ## [1] 5 6 ## ## [[3]] ## [1] 9 10 11 ``` --- # Multiple arguments ```r map(l, list("y", 1)) ``` ``` ## [[1]] ## [1] 2 ## ## [[2]] ## [1] 5 ## ## [[3]] ## [1] 9 ``` --- class:inverse-red middle # {purrr} variants --- # Return a vector * `map_dbl` * `map_int` * `map_chr` * `map_lgl` --- .pull-left[ ```r str(l) ``` ``` ## List of 3 ## $ :List of 4 ## ..$ : num -1 ## ..$ x: num 1 ## ..$ y: num 2 ## ..$ z: chr "a" ## $ :List of 4 ## ..$ : num -2 ## ..$ x: num 4 ## ..$ y: num [1:2] 5 6 ## ..$ z: chr "b" ## $ :List of 3 ## ..$ : num -3 ## ..$ x: num 8 ## ..$ y: num [1:3] 9 10 11 ``` ] -- .pull-right[ ```r map_dbl(l, "x") ``` ``` ## [1] 1 4 8 ``` ```r map_dbl(l, 1) ``` ``` ## [1] -1 -2 -3 ``` ] --- # Type match * Coercion will occur if you request a different type ```r map_chr(l, "x") ``` ``` ## [1] "1.000000" "4.000000" "8.000000" ``` -- * You'll get an error if element doesn't exist ```r map_chr(l, "z") ``` ``` ## Error in `stop_bad_type()`: ## ! Result 3 must be a single string, not NULL of length 0 ``` --- * Unless you set a default value ```r map_chr(l, "z", .default = NA_character_) ``` ``` ## [1] "a" "b" NA ``` --- # Quick note: missing values * In the prior case, specifying `NA` would work, instead of `NA_character_` -- * Generally, I think it's better to specify the type. -- * **General programming rule:** The more strict the better -- * Because (base) R likes to be inconsistent, here are the `NA` types .pull-left[ | Type | NA value| |:-----|:-------:| | character | NA\_character\_ | | integer | NA\_integer\_ | | double | NA\_real\_ | | logical | NA (see [here](https://stackoverflow.com/questions/19564748/why-is-there-no-na-logical)) | ] -- .pull-right[ ```r typeof(NA) ``` ``` ## [1] "logical" ``` ] --- # More quick examples Please copy the code below so you have it locally. ```r df_list <- list( data.frame(var1 = 1:5), data.frame(var1 = 1:3), data.frame(var1 = 1) ) ``` --- # Compute `mean(var1)` For each data frame. You try first! <div class="countdown" id="timer_6227e944" style="right:0;bottom:0;" data-warnwhen="0"> <code class="countdown-time"><span class="countdown-digits minutes">04</span><span class="countdown-digits colon">:</span><span class="countdown-digits seconds">00</span></code> </div> -- ```r map(df_list, ~mean(.x$var1)) ``` ``` ## [[1]] ## [1] 3 ## ## [[2]] ## [1] 2 ## ## [[3]] ## [1] 1 ``` --- # Return a vector ```r map_dbl(df_list, ~mean(.x$var1)) ``` ``` ## [1] 3 2 1 ``` -- Try out coercion ```r map_chr(df_list, ~mean(.x$var1)) ``` ``` ## [1] "3.000000" "2.000000" "1.000000" ``` ```r map_lgl(df_list, ~mean(.x$var1)) ``` ``` ## Error: Can't coerce element 1 from a double to a logical ``` ```r # Manual override map_lgl(df_list, ~as.logical(mean(.x$var1))) ``` ``` ## [1] TRUE TRUE TRUE ``` --- # Some more examples ### Please follow along ```r econ <- economics %>% mutate(year = lubridate::year(date)) econ ``` ``` ## # A tibble: 574 × 7 ## date pce pop psavert uempmed unemploy year ## <date> <dbl> <dbl> <dbl> <dbl> <dbl> <dbl> ## 1 1967-07-01 506.7 198712 12.6 4.5 2944 1967 ## 2 1967-08-01 509.8 198911 12.6 4.7 2945 1967 ## 3 1967-09-01 515.6 199113 11.9 4.6 2958 1967 ## 4 1967-10-01 512.2 199311 12.9 4.9 3143 1967 ## 5 1967-11-01 517.4 199498 12.8 4.7 3066 1967 ## 6 1967-12-01 525.1 199657 11.8 4.8 3018 1967 ## 7 1968-01-01 530.9 199808 11.7 5.1 2878 1968 ## 8 1968-02-01 533.6 199920 12.3 4.5 3001 1968 ## 9 1968-03-01 544.3 200056 11.7 4.1 2877 1968 ## 10 1968-04-01 544 200208 12.3 4.6 2709 1968 ## # … with 564 more rows ``` --- # by_year ```r by_year <- split(econ, econ$year) str(by_year) ``` ``` ## List of 49 ## $ 1967: tibble [6 × 7] (S3: tbl_df/tbl/data.frame) ## ..$ date : Date[1:6], format: "1967-07-01" "1967-08-01" ... ## ..$ pce : num [1:6] 507 510 516 512 517 ... ## ..$ pop : num [1:6] 198712 198911 199113 199311 199498 ... ## ..$ psavert : num [1:6] 12.6 12.6 11.9 12.9 12.8 11.8 ## ..$ uempmed : num [1:6] 4.5 4.7 4.6 4.9 4.7 4.8 ## ..$ unemploy: num [1:6] 2944 2945 2958 3143 3066 ... ## ..$ year : num [1:6] 1967 1967 1967 1967 1967 ... ## $ 1968: tibble [12 × 7] (S3: tbl_df/tbl/data.frame) ## ..$ date : Date[1:12], format: "1968-01-01" "1968-02-01" ... ## ..$ pce : num [1:12] 531 534 544 544 550 ... ## ..$ pop : num [1:12] 2e+05 2e+05 2e+05 2e+05 2e+05 ... ## ..$ psavert : num [1:12] 11.7 12.3 11.7 12.3 12 11.7 10.7 10.5 10.6 10.8 ... ## ..$ uempmed : num [1:12] 5.1 4.5 4.1 4.6 4.4 4.4 4.5 4.2 4.6 4.8 ... ## ..$ unemploy: num [1:12] 2878 3001 2877 2709 2740 ... ## ..$ year : num [1:12] 1968 1968 1968 1968 1968 ... ## $ 1969: tibble [12 × 7] (S3: tbl_df/tbl/data.frame) ## ..$ date : Date[1:12], format: "1969-01-01" "1969-02-01" ... ## ..$ pce : num [1:12] 584 589 589 594 600 ... ## ..$ pop : num [1:12] 201760 201881 202023 202161 202331 ... ## ..$ psavert : num [1:12] 10.3 9.7 10.2 9.7 10.1 11.1 11.8 11.5 11.6 11.4 ... ## ..$ uempmed : num [1:12] 4.4 4.9 4 4 4.2 4.4 4.4 4.4 4.7 4.5 ... ## ..$ unemploy: num [1:12] 2718 2692 2712 2758 2713 ... ## ..$ year : num [1:12] 1969 1969 1969 1969 1969 ... ## $ 1970: tibble [12 × 7] (S3: tbl_df/tbl/data.frame) ## ..$ date : Date[1:12], format: "1970-01-01" "1970-02-01" ... ## ..$ pce : num [1:12] 629 634 632 636 642 ... ## ..$ pop : num [1:12] 203849 204008 204156 204401 204607 ... ## ..$ psavert : num [1:12] 11.8 11.7 12.4 13.3 12.4 12.3 13.5 13.4 12.9 13.1 ... ## ..$ uempmed : num [1:12] 4.6 4.5 4.6 4.1 4.7 4.9 5.1 5.4 5.2 5.2 ... ## ..$ unemploy: num [1:12] 3201 3453 3635 3797 3919 ... ## ..$ year : num [1:12] 1970 1970 1970 1970 1970 1970 1970 1970 1970 1970 ... ## $ 1971: tibble [12 × 7] (S3: tbl_df/tbl/data.frame) ## ..$ date : Date[1:12], format: "1971-01-01" "1971-02-01" ... ## ..$ pce : num [1:12] 676 679 682 689 691 ... ## ..$ pop : num [1:12] 206466 206668 206855 207065 207260 ... ## ..$ psavert : num [1:12] 13.3 13.3 13.5 13.2 13.6 14.7 13.8 13.6 13.3 13.3 ... ## ..$ uempmed : num [1:12] 6.2 6.3 6.4 6.5 6.7 5.7 6.2 6.4 5.8 6.5 ... ## ..$ unemploy: num [1:12] 4986 4903 4987 4959 4996 ... ## ..$ year : num [1:12] 1971 1971 1971 1971 1971 ... ## $ 1972: tibble [12 × 7] (S3: tbl_df/tbl/data.frame) ## ..$ date : Date[1:12], format: "1972-01-01" "1972-02-01" ... ## ..$ pce : num [1:12] 732 736 749 752 758 ... ## ..$ pop : num [1:12] 208917 209061 209212 209386 209545 ... ## ..$ psavert : num [1:12] 12.5 12.8 11.8 11.5 11.7 11.7 11.7 12 12.2 13 ... ## ..$ uempmed : num [1:12] 6.2 6.6 6.6 6.7 6.6 5.4 6.1 6 5.6 5.7 ... ## ..$ unemploy: num [1:12] 5019 4928 5038 4959 4922 ... ## ..$ year : num [1:12] 1972 1972 1972 1972 1972 ... ## $ 1973: tibble [12 × 7] (S3: tbl_df/tbl/data.frame) ## ..$ date : Date[1:12], format: "1973-01-01" "1973-02-01" ... ## ..$ pce : num [1:12] 816 826 833 836 842 ... ## ..$ pop : num [1:12] 210985 211120 211254 211420 211577 ... ## ..$ psavert : num [1:12] 12.4 12.5 12.7 13.2 13.2 13.6 13.2 13.9 13.1 14.4 ... ## ..$ uempmed : num [1:12] 5.7 5.2 5.5 5 4.9 5 5.2 4.9 5.4 5.5 ... ## ..$ unemploy: num [1:12] 4326 4452 4394 4459 4329 ... ## ..$ year : num [1:12] 1973 1973 1973 1973 1973 ... ## $ 1974: tibble [12 × 7] (S3: tbl_df/tbl/data.frame) ## ..$ date : Date[1:12], format: "1974-01-01" "1974-02-01" ... ## ..$ pce : num [1:12] 884 890 901 911 922 ... ## ..$ pop : num [1:12] 212932 213074 213211 213361 213513 ... ## ..$ psavert : num [1:12] 14.3 14.2 13.4 13.1 12.8 12.8 12.8 12.1 12.9 13.4 ... ## ..$ uempmed : num [1:12] 5 5.1 4.8 5 4.6 5.3 5.7 5 5.3 5.5 ... ## ..$ unemploy: num [1:12] 4644 4731 4634 4618 4705 ... ## ..$ year : num [1:12] 1974 1974 1974 1974 1974 ... ## $ 1975: tibble [12 × 7] (S3: tbl_df/tbl/data.frame) ## ..$ date : Date[1:12], format: "1975-01-01" "1975-02-01" ... ## ..$ pce : num [1:12] 976 989 991 995 1019 ... ## ..$ pop : num [1:12] 214931 215065 215198 215353 215523 ... ## ..$ psavert : num [1:12] 13.2 12.5 12.7 14.2 17.3 14.3 12.6 13 13 13.4 ... ## ..$ uempmed : num [1:12] 6.3 7.1 7.2 8.7 9.4 8.8 8.6 9.2 9.2 8.6 ... ## ..$ unemploy: num [1:12] 7501 7520 7978 8210 8433 ... ## ..$ year : num [1:12] 1975 1975 1975 1975 1975 ... ## $ 1976: tibble [12 × 7] (S3: tbl_df/tbl/data.frame) ## ..$ date : Date[1:12], format: "1976-01-01" "1976-02-01" ... ## ..$ pce : num [1:12] 1107 1108 1115 1125 1123 ... ## ..$ pop : num [1:12] 217095 217249 217381 217528 217685 ... ## ..$ psavert : num [1:12] 11.7 12.3 12.2 11.7 12.3 11.4 11.7 11.7 11.4 11.1 ... ## ..$ uempmed : num [1:12] 9 8.2 8.7 8.2 8.3 7.8 7.7 7.9 7.8 7.7 ... ## ..$ unemploy: num [1:12] 7534 7326 7230 7330 7053 ... ## ..$ year : num [1:12] 1976 1976 1976 1976 1976 ... ## $ 1977: tibble [12 × 7] (S3: tbl_df/tbl/data.frame) ## ..$ date : Date[1:12], format: "1977-01-01" "1977-02-01" ... ## ..$ pce : num [1:12] 1215 1231 1238 1247 1257 ... ## ..$ pop : num [1:12] 219179 219344 219504 219684 219859 ... ## ..$ psavert : num [1:12] 10.6 9.3 10.5 10.5 10.3 10.6 10.5 10.9 11.1 11 ... ## ..$ uempmed : num [1:12] 7.5 7.2 7.2 7.3 7.9 6.2 7.1 7 6.7 6.9 ... ## ..$ unemploy: num [1:12] 7280 7443 7307 7059 6911 ... ## ..$ year : num [1:12] 1977 1977 1977 1977 1977 ... ## $ 1978: tibble [12 × 7] (S3: tbl_df/tbl/data.frame) ## ..$ date : Date[1:12], format: "1978-01-01" "1978-02-01" ... ## ..$ pce : num [1:12] 1330 1355 1378 1396 1412 ... ## ..$ pop : num [1:12] 221477 221629 221792 221991 222176 ... ## ..$ psavert : num [1:12] 11.9 11.1 11 10.8 10.3 10 10.9 10.5 10.6 10.7 ... ## ..$ uempmed : num [1:12] 6.5 6.7 6.2 6.1 5.7 6 5.8 5.8 5.6 5.9 ... ## ..$ unemploy: num [1:12] 6489 6318 6337 6180 6127 ... ## ..$ year : num [1:12] 1978 1978 1978 1978 1978 ... ## $ 1979: tibble [12 × 7] (S3: tbl_df/tbl/data.frame) ## ..$ date : Date[1:12], format: "1979-01-01" "1979-02-01" ... ## ..$ pce : num [1:12] 1502 1518 1531 1538 1559 ... ## ..$ pop : num [1:12] 223865 224053 224235 224438 224632 ... ## ..$ psavert : num [1:12] 11.1 11.1 11.2 11 10.3 9.9 10.6 9.7 9.4 9.7 ... ## ..$ uempmed : num [1:12] 5.9 5.9 5.9 5.4 5.6 5.6 5.9 4.8 5.5 5.5 ... ## ..$ unemploy: num [1:12] 6109 6173 6109 6069 5840 ... ## ..$ year : num [1:12] 1979 1979 1979 1979 1979 ... ## $ 1980: tibble [12 × 7] (S3: tbl_df/tbl/data.frame) ## ..$ date : Date[1:12], format: "1980-01-01" "1980-02-01" ... ## ..$ pce : num [1:12] 1697 1701 1708 1695 1700 ... ## ..$ pop : num [1:12] 226451 226656 226849 227061 227251 ... ## ..$ psavert : num [1:12] 9.9 10.1 10.2 11.3 11.4 11.2 11.3 11.3 11.7 11.3 ... ## ..$ uempmed : num [1:12] 5.3 5.8 6 5.8 5.7 6.4 7 7.5 7.7 7.5 ... ## ..$ unemploy: num [1:12] 6683 6702 6729 7358 7984 ... ## ..$ year : num [1:12] 1980 1980 1980 1980 1980 1980 1980 1980 1980 1980 ... ## $ 1981: tibble [12 × 7] (S3: tbl_df/tbl/data.frame) ## ..$ date : Date[1:12], format: "1981-01-01" "1981-02-01" ... ## ..$ pce : num [1:12] 1870 1884 1903 1904 1914 ... ## ..$ pop : num [1:12] 228937 229071 229224 229403 229575 ... ## ..$ psavert : num [1:12] 10.9 10.8 10.8 10.9 11 10.8 12.3 12 12.4 13 ... ## ..$ uempmed : num [1:12] 7.4 7.1 7.1 7.4 6.9 6.6 7.1 7.2 6.8 6.8 ... ## ..$ unemploy: num [1:12] 8071 8051 7982 7869 8174 ... ## ..$ year : num [1:12] 1981 1981 1981 1981 1981 ... ## $ 1982: tibble [12 × 7] (S3: tbl_df/tbl/data.frame) ## ..$ date : Date[1:12], format: "1982-01-01" "1982-02-01" ... ## ..$ pce : num [1:12] 1997 2021 2024 2026 2044 ... ## ..$ pop : num [1:12] 231157 231313 231470 231645 231809 ... ## ..$ psavert : num [1:12] 12.7 12.1 12.2 12.9 12.3 12.3 12.5 12.6 11.8 11.3 ... ## ..$ uempmed : num [1:12] 7.1 7.5 7.7 8.1 8.5 9.5 8.5 8.7 9.5 9.7 ... ## ..$ unemploy: num [1:12] 9397 9705 9895 10244 10335 ... ## ..$ year : num [1:12] 1982 1982 1982 1982 1982 ... ## $ 1983: tibble [12 × 7] (S3: tbl_df/tbl/data.frame) ## ..$ date : Date[1:12], format: "1983-01-01" "1983-02-01" ... ## ..$ pce : num [1:12] 2174 2177 2203 2226 2246 ... ## ..$ pop : num [1:12] 233322 233473 233613 233781 233922 ... ## ..$ psavert : num [1:12] 11.1 11.1 10.6 10.3 9.9 9.1 9.6 9.2 9.6 9.7 ... ## ..$ uempmed : num [1:12] 11.1 9.8 10.4 10.9 12.3 11.3 10.1 9.3 9.3 9.4 ... ## ..$ unemploy: num [1:12] 11534 11545 11408 11268 11154 ... ## ..$ year : num [1:12] 1983 1983 1983 1983 1983 ... ## $ 1984: tibble [12 × 7] (S3: tbl_df/tbl/data.frame) ## ..$ date : Date[1:12], format: "1984-01-01" "1984-02-01" ... ## ..$ pce : num [1:12] 2419 2404 2432 2458 2474 ... ## ..$ pop : num [1:12] 235385 235527 235675 235839 235993 ... ## ..$ psavert : num [1:12] 10 11.7 11.5 11.5 11.1 11.1 11.6 11.8 11.8 11.7 ... ## ..$ uempmed : num [1:12] 9.1 8.3 8.3 8.2 9.1 7.5 7.5 7.3 7.6 7.2 ... ## ..$ unemploy: num [1:12] 9008 8791 8746 8762 8456 ... ## ..$ year : num [1:12] 1984 1984 1984 1984 1984 ... ## $ 1985: tibble [12 × 7] (S3: tbl_df/tbl/data.frame) ## ..$ date : Date[1:12], format: "1985-01-01" "1985-02-01" ... ## ..$ pce : num [1:12] 2619 2641 2648 2660 2696 ... ## ..$ pop : num [1:12] 237468 237602 237732 237900 238074 ... ## ..$ psavert : num [1:12] 10.3 9.1 8.7 9.9 11.1 9.6 9.1 8.2 7.3 9.1 ... ## ..$ uempmed : num [1:12] 6.8 7.1 7.1 6.9 6.9 6.6 6.9 7.1 6.9 7.1 ... ## ..$ unemploy: num [1:12] 8423 8321 8339 8395 8302 ... ## ..$ year : num [1:12] 1985 1985 1985 1985 1985 ... ## $ 1986: tibble [12 × 7] (S3: tbl_df/tbl/data.frame) ## ..$ date : Date[1:12], format: "1986-01-01" "1986-02-01" ... ## ..$ pce : num [1:12] 2827 2820 2824 2835 2858 ... ## ..$ pop : num [1:12] 239638 239788 239928 240094 240271 ... ## ..$ psavert : num [1:12] 8.6 9.3 9.9 9.7 9.3 9.4 9.3 9 7.2 8.4 ... ## ..$ uempmed : num [1:12] 6.7 6.9 6.8 6.7 6.8 7 6.9 7.1 7.4 7 ... ## ..$ unemploy: num [1:12] 7795 8402 8383 8364 8439 ... ## ..$ year : num [1:12] 1986 1986 1986 1986 1986 ... ## $ 1987: tibble [12 × 7] (S3: tbl_df/tbl/data.frame) ## ..$ date : Date[1:12], format: "1987-01-01" "1987-02-01" ... ## ..$ pce : num [1:12] 2936 3002 3013 3039 3048 ... ## ..$ pop : num [1:12] 241784 241930 242079 242252 242423 ... ## ..$ psavert : num [1:12] 9.7 8.5 8.5 4.5 8.2 7.7 7.5 7.2 7.6 8.3 ... ## ..$ uempmed : num [1:12] 6.9 6.6 6.6 7.1 6.6 6.5 6.5 6.4 6 6.3 ... ## ..$ unemploy: num [1:12] 7892 7865 7862 7542 7574 ... ## ..$ year : num [1:12] 1987 1987 1987 1987 1987 ... ## $ 1988: tibble [12 × 7] (S3: tbl_df/tbl/data.frame) ## ..$ date : Date[1:12], format: "1988-01-01" "1988-02-01" ... ## ..$ pce : num [1:12] 3214 3221 3260 3263 3294 ... ## ..$ pop : num [1:12] 243981 244131 244279 244445 244610 ... ## ..$ psavert : num [1:12] 8.1 8.6 8.2 8.8 8.4 8.4 8.6 8.4 8.9 8.6 ... ## ..$ uempmed : num [1:12] 6.2 6.3 6.4 5.9 5.9 5.8 6.1 5.9 5.7 5.6 ... ## ..$ unemploy: num [1:12] 6953 6929 6876 6601 6779 ... ## ..$ year : num [1:12] 1988 1988 1988 1988 1988 ... ## $ 1989: tibble [12 × 7] (S3: tbl_df/tbl/data.frame) ## ..$ date : Date[1:12], format: "1989-01-01" "1989-02-01" ... ## ..$ pce : num [1:12] 3484 3488 3499 3543 3552 ... ## ..$ pop : num [1:12] 246224 246378 246530 246721 246906 ... ## ..$ psavert : num [1:12] 8.5 9 9.5 8.4 8.1 8.2 8.2 7.6 8.1 8.5 ... ## ..$ uempmed : num [1:12] 5.6 5.4 5.4 5.4 5.3 5.4 5.6 5 4.9 4.9 ... ## ..$ unemploy: num [1:12] 6682 6359 6205 6468 6375 ... ## ..$ year : num [1:12] 1989 1989 1989 1989 1989 ... ## $ 1990: tibble [12 × 7] (S3: tbl_df/tbl/data.frame) ## ..$ date : Date[1:12], format: "1990-01-01" "1990-02-01" ... ## ..$ pce : num [1:12] 3731 3728 3755 3770 3776 ... ## ..$ pop : num [1:12] 248659 248827 249012 249306 249565 ... ## ..$ psavert : num [1:12] 8 8.6 8.3 8.8 8.7 8.6 8.7 8.1 8.1 7.8 ... ## ..$ uempmed : num [1:12] 5.1 5.3 5.1 4.8 5.2 5.2 5.4 5.4 5.6 5.8 ... ## ..$ unemploy: num [1:12] 6752 6651 6598 6797 6742 ... ## ..$ year : num [1:12] 1990 1990 1990 1990 1990 1990 1990 1990 1990 1990 ... ## $ 1991: tibble [12 × 7] (S3: tbl_df/tbl/data.frame) ## ..$ date : Date[1:12], format: "1991-01-01" "1991-02-01" ... ## ..$ pce : num [1:12] 3841 3867 3913 3907 3933 ... ## ..$ pop : num [1:12] 251889 252135 252372 252643 252913 ... ## ..$ psavert : num [1:12] 9.3 8.8 8 8.6 8.4 8.9 8.2 8.6 8.8 9.3 ... ## ..$ uempmed : num [1:12] 6 6.2 6.7 6.6 6.4 6.9 7 7.3 6.8 7.2 ... ## ..$ unemploy: num [1:12] 8015 8265 8586 8439 8736 ... ## ..$ year : num [1:12] 1991 1991 1991 1991 1991 ... ## $ 1992: tibble [12 × 7] (S3: tbl_df/tbl/data.frame) ## ..$ date : Date[1:12], format: "1992-01-01" "1992-02-01" ... ## ..$ pce : num [1:12] 4085 4100 4117 4132 4158 ... ## ..$ pop : num [1:12] 255214 255448 255703 255992 256285 ... ## ..$ psavert : num [1:12] 9.4 9.8 9.7 9.9 9.9 10.1 9.6 9.7 8.7 8 ... ## ..$ uempmed : num [1:12] 8.1 8.2 8.3 8.5 8.8 8.7 8.6 8.8 8.6 9 ... ## ..$ unemploy: num [1:12] 9283 9454 9460 9415 9744 ... ## ..$ year : num [1:12] 1992 1992 1992 1992 1992 ... ## $ 1993: tibble [12 × 7] (S3: tbl_df/tbl/data.frame) ## ..$ date : Date[1:12], format: "1993-01-01" "1993-02-01" ... ## ..$ pce : num [1:12] 4341 4355 4352 4393 4422 ... ## ..$ pop : num [1:12] 258679 258919 259152 259414 259680 ... ## ..$ psavert : num [1:12] 8.6 8.9 8.9 8.7 8.3 7.8 7.6 7.7 6.9 6.3 ... ## ..$ uempmed : num [1:12] 8.6 8.5 8.5 8.4 8.1 8.3 8.2 8.2 8.3 8 ... ## ..$ unemploy: num [1:12] 9325 9183 9056 9110 9149 ... ## ..$ year : num [1:12] 1993 1993 1993 1993 1993 ... ## $ 1994: tibble [12 × 7] (S3: tbl_df/tbl/data.frame) ## ..$ date : Date[1:12], format: "1994-01-01" "1994-02-01" ... ## ..$ pce : num [1:12] 4585 4633 4646 4671 4670 ... ## ..$ pop : num [1:12] 261919 262123 262352 262631 262877 ... ## ..$ psavert : num [1:12] 7.1 6.5 6.8 6.4 7.6 6.9 7 6.5 6.8 7.1 ... ## ..$ uempmed : num [1:12] 8.6 9.2 9.3 9.1 9.2 9.3 9 8.9 9.2 10 ... ## ..$ unemploy: num [1:12] 8630 8583 8470 8331 7915 ... ## ..$ year : num [1:12] 1994 1994 1994 1994 1994 ... ## $ 1995: tibble [12 × 7] (S3: tbl_df/tbl/data.frame) ## ..$ date : Date[1:12], format: "1995-01-01" "1995-02-01" ... ## ..$ pce : num [1:12] 4851 4851 4885 4890 4933 ... ## ..$ pop : num [1:12] 265044 265270 265495 265755 265998 ... ## ..$ psavert : num [1:12] 7.5 7.8 7.5 6.9 7.1 6.7 7.1 6.7 6.8 7.1 ... ## ..$ uempmed : num [1:12] 8 8.1 8.3 8.3 9.1 7.9 8.5 8.3 7.9 8.2 ... ## ..$ unemploy: num [1:12] 7375 7187 7153 7645 7430 ... ## ..$ year : num [1:12] 1995 1995 1995 1995 1995 ... ## $ 1996: tibble [12 × 7] (S3: tbl_df/tbl/data.frame) ## ..$ date : Date[1:12], format: "1996-01-01" "1996-02-01" ... ## ..$ pce : num [1:12] 5086 5133 5173 5208 5224 ... ## ..$ pop : num [1:12] 268151 268364 268595 268853 269108 ... ## ..$ psavert : num [1:12] 6.7 6.7 6.6 5.7 6.7 7.1 6.7 6.6 6.7 6.4 ... ## ..$ uempmed : num [1:12] 8.3 7.8 8.3 8.6 8.6 8.3 8.3 8.4 8.5 8.3 ... ## ..$ unemploy: num [1:12] 7491 7313 7318 7415 7423 ... ## ..$ year : num [1:12] 1996 1996 1996 1996 1996 ... ## $ 1997: tibble [12 × 7] (S3: tbl_df/tbl/data.frame) ## ..$ date : Date[1:12], format: "1997-01-01" "1997-02-01" ... ## ..$ pce : num [1:12] 5411 5434 5454 5459 5460 ... ## ..$ pop : num [1:12] 271360 271585 271821 272083 272342 ... ## ..$ psavert : num [1:12] 6.2 6.2 6.4 6.5 6.8 6.6 6.1 6 6.2 6.2 ... ## ..$ uempmed : num [1:12] 7.8 8.1 7.9 8.3 8 8 8.3 7.8 8.2 7.7 ... ## ..$ unemploy: num [1:12] 7158 7102 7000 6873 6655 ... ## ..$ year : num [1:12] 1997 1997 1997 1997 1997 ... ## $ 1998: tibble [12 × 7] (S3: tbl_df/tbl/data.frame) ## ..$ date : Date[1:12], format: "1998-01-01" "1998-02-01" ... ## ..$ pce : num [1:12] 5690 5724 5750 5788 5838 ... ## ..$ pop : num [1:12] 274626 274838 275047 275304 275564 ... ## ..$ psavert : num [1:12] 7.4 7.4 7.5 7.2 6.9 6.8 6.9 6.8 6.4 6.2 ... ## ..$ uempmed : num [1:12] 7.4 7 6.8 6.7 6 6.9 6.7 6.8 6.7 5.8 ... ## ..$ unemploy: num [1:12] 6368 6306 6422 5941 6047 ... ## ..$ year : num [1:12] 1998 1998 1998 1998 1998 ... ## $ 1999: tibble [12 × 7] (S3: tbl_df/tbl/data.frame) ## ..$ date : Date[1:12], format: "1999-01-01" "1999-02-01" ... ## ..$ pce : num [1:12] 6073 6102 6133 6196 6226 ... ## ..$ pop : num [1:12] 277790 277992 278198 278451 278717 ... ## ..$ psavert : num [1:12] 6.4 6.2 5.9 5.2 4.9 4.8 4.8 4.7 4.2 4.6 ... ## ..$ uempmed : num [1:12] 6.9 6.8 6.8 6.2 6.5 6.3 5.8 6.5 6 6.1 ... ## ..$ unemploy: num [1:12] 5976 6111 5783 6004 5796 ... ## ..$ year : num [1:12] 1999 1999 1999 1999 1999 ... ## $ 2000: tibble [12 × 7] (S3: tbl_df/tbl/data.frame) ## ..$ date : Date[1:12], format: "2000-01-01" "2000-02-01" ... ## ..$ pce : num [1:12] 6535 6620 6686 6671 6708 ... ## ..$ pop : num [1:12] 280976 281190 281409 281653 281877 ... ## ..$ psavert : num [1:12] 5.4 4.8 4.5 5 4.9 4.9 5.2 5.2 4.5 4.6 ... ## ..$ uempmed : num [1:12] 5.8 6.1 6 6.1 5.8 5.7 6 6.3 5.2 6.1 ... ## ..$ unemploy: num [1:12] 5708 5858 5733 5481 5758 ... ## ..$ year : num [1:12] 2000 2000 2000 2000 2000 2000 2000 2000 2000 2000 ... ## $ 2001: tibble [12 × 7] (S3: tbl_df/tbl/data.frame) ## ..$ date : Date[1:12], format: "2001-01-01" "2001-02-01" ... ## ..$ pce : num [1:12] 6977 6996 6988 7001 7047 ... ## ..$ pop : num [1:12] 283920 284137 284350 284581 284810 ... ## ..$ psavert : num [1:12] 4.8 4.9 5.3 5 4.5 4.5 5.6 6.8 7 3.4 ... ## ..$ uempmed : num [1:12] 5.8 6.1 6.6 5.9 6.3 6 6.8 6.9 7.2 7.3 ... ## ..$ unemploy: num [1:12] 6023 6089 6141 6271 6226 ... ## ..$ year : num [1:12] 2001 2001 2001 2001 2001 ... ## $ 2002: tibble [12 × 7] (S3: tbl_df/tbl/data.frame) ## ..$ date : Date[1:12], format: "2002-01-01" "2002-02-01" ... ## ..$ pce : num [1:12] 7174 7218 7237 7305 7283 ... ## ..$ pop : num [1:12] 286788 286994 287190 287397 287623 ... ## ..$ psavert : num [1:12] 6.1 5.8 5.9 5.8 6.5 6.4 5.5 5.4 5.7 5.7 ... ## ..$ uempmed : num [1:12] 8.4 8.3 8.4 8.9 9.5 11 8.9 9 9.5 9.6 ... ## ..$ unemploy: num [1:12] 8182 8215 8304 8599 8399 ... ## ..$ year : num [1:12] 2002 2002 2002 2002 2002 ... ## $ 2003: tibble [12 × 7] (S3: tbl_df/tbl/data.frame) ## ..$ date : Date[1:12], format: "2003-01-01" "2003-02-01" ... ## ..$ pce : num [1:12] 7533 7536 7598 7621 7628 ... ## ..$ pop : num [1:12] 289518 289714 289911 290125 290346 ... ## ..$ psavert : num [1:12] 5.5 5.6 5.3 5.3 5.8 5.6 6.3 6 5.2 5.3 ... ## ..$ uempmed : num [1:12] 9.6 9.5 9.7 10.2 9.9 11.5 10.3 10.1 10.2 10.4 ... ## ..$ unemploy: num [1:12] 8520 8618 8588 8842 8957 ... ## ..$ year : num [1:12] 2003 2003 2003 2003 2003 ... ## $ 2004: tibble [12 × 7] (S3: tbl_df/tbl/data.frame) ## ..$ date : Date[1:12], format: "2004-01-01" "2004-02-01" ... ## ..$ pce : num [1:12] 7987 8020 8076 8089 8163 ... ## ..$ pop : num [1:12] 292192 292368 292561 292779 292997 ... ## ..$ psavert : num [1:12] 5 5 4.9 5.3 5.3 5.8 5.3 5.2 4.6 4.5 ... ## ..$ uempmed : num [1:12] 10.6 10.2 10.2 9.5 9.9 11 8.9 9.2 9.6 9.5 ... ## ..$ unemploy: num [1:12] 8370 8167 8491 8170 8212 ... ## ..$ year : num [1:12] 2004 2004 2004 2004 2004 ... ## $ 2005: tibble [12 × 7] (S3: tbl_df/tbl/data.frame) ## ..$ date : Date[1:12], format: "2005-01-01" "2005-02-01" ... ## ..$ pce : num [1:12] 8470 8529 8570 8646 8644 ... ## ..$ pop : num [1:12] 294914 295105 295287 295490 295704 ... ## ..$ psavert : num [1:12] 3.7 3.4 3.6 3.1 3.5 2.9 2.2 2.7 2.7 3.1 ... ## ..$ uempmed : num [1:12] 9.4 9.2 9.3 9 9.1 9 8.8 9.2 8.4 8.6 ... ## ..$ unemploy: num [1:12] 7784 7980 7737 7672 7651 ... ## ..$ year : num [1:12] 2005 2005 2005 2005 2005 ... ## $ 2006: tibble [12 × 7] (S3: tbl_df/tbl/data.frame) ## ..$ date : Date[1:12], format: "2006-01-01" "2006-02-01" ... ## ..$ pce : num [1:12] 9060 9090 9122 9175 9215 ... ## ..$ pop : num [1:12] 297647 297854 298060 298281 298496 ... ## ..$ psavert : num [1:12] 4.2 4.2 4.2 4 3.8 4 3.4 3.6 3.6 3.6 ... ## ..$ uempmed : num [1:12] 8.6 9.1 8.7 8.4 8.5 7.3 8 8.4 8 7.9 ... ## ..$ unemploy: num [1:12] 7064 7184 7072 7120 6980 ... ## ..$ year : num [1:12] 2006 2006 2006 2006 2006 ... ## $ 2007: tibble [12 × 7] (S3: tbl_df/tbl/data.frame) ## ..$ date : Date[1:12], format: "2007-01-01" "2007-02-01" ... ## ..$ pce : num [1:12] 9516 9547 9585 9616 9651 ... ## ..$ pop : num [1:12] 300574 300802 301021 301254 301483 ... ## ..$ psavert : num [1:12] 3.7 4.1 4.4 4.2 4 3.8 3.7 3.4 3.5 3.4 ... ## ..$ uempmed : num [1:12] 8.3 8.5 9.1 8.6 8.2 7.7 8.7 8.8 8.7 8.4 ... ## ..$ unemploy: num [1:12] 7116 6927 6731 6850 6766 ... ## ..$ year : num [1:12] 2007 2007 2007 2007 2007 ... ## $ 2008: tibble [12 × 7] (S3: tbl_df/tbl/data.frame) ## ..$ date : Date[1:12], format: "2008-01-01" "2008-02-01" ... ## ..$ pce : num [1:12] 9930 9913 9959 9997 10054 ... ## ..$ pop : num [1:12] 303506 303711 303907 304117 304323 ... ## ..$ psavert : num [1:12] 3.7 4.1 4 3.4 7.8 5.5 4.4 3.8 4.7 5.5 ... ## ..$ uempmed : num [1:12] 9 8.7 8.7 9.4 7.9 9 9.7 9.7 10.2 10.4 ... ## ..$ unemploy: num [1:12] 7685 7497 7822 7637 8395 ... ## ..$ year : num [1:12] 2008 2008 2008 2008 2008 ... ## $ 2009: tibble [12 × 7] (S3: tbl_df/tbl/data.frame) ## ..$ date : Date[1:12], format: "2009-01-01" "2009-02-01" ... ## ..$ pce : num [1:12] 9784 9766 9718 9725 9749 ... ## ..$ pop : num [1:12] 306208 306402 306588 306787 306984 ... ## ..$ psavert : num [1:12] 6.2 5.5 5.9 6.8 8.2 6.7 6 4.9 5.9 5.4 ... ## ..$ uempmed : num [1:12] 10.7 11.7 12.3 13.1 14.2 17.2 16 16.3 17.8 18.9 ... ## ..$ unemploy: num [1:12] 12058 12898 13426 13853 14499 ... ## ..$ year : num [1:12] 2009 2009 2009 2009 2009 ... ## $ 2010: tibble [12 × 7] (S3: tbl_df/tbl/data.frame) ## ..$ date : Date[1:12], format: "2010-01-01" "2010-02-01" ... ## ..$ pce : num [1:12] 10002 10031 10089 10113 10131 ... ## ..$ pop : num [1:12] 308833 309027 309212 309191 309369 ... ## ..$ psavert : num [1:12] 6.1 5.8 5.7 6.4 7 6.9 6.8 6.9 6.7 6.6 ... ## ..$ uempmed : num [1:12] 20 19.9 20.4 22.1 22.3 25.2 22.3 21 20.3 21.2 ... ## ..$ unemploy: num [1:12] 15046 15113 15202 15325 14849 ... ## ..$ year : num [1:12] 2010 2010 2010 2010 2010 2010 2010 2010 2010 2010 ... ## $ 2011: tibble [12 × 7] (S3: tbl_df/tbl/data.frame) ## ..$ date : Date[1:12], format: "2011-01-01" "2011-02-01" ... ## ..$ pce : num [1:12] 10436 10470 10550 10588 10612 ... ## ..$ pop : num [1:12] 310961 311113 311265 311436 311607 ... ## ..$ psavert : num [1:12] 7.4 7.6 7 6.9 6.9 7.2 7.3 7.2 6.8 6.8 ... ## ..$ uempmed : num [1:12] 21.5 21.1 21.5 20.9 21.6 22.4 22 22.4 22 20.6 ... ## ..$ unemploy: num [1:12] 14013 13820 13737 13957 13855 ... ## ..$ year : num [1:12] 2011 2011 2011 2011 2011 ... ## $ 2012: tibble [12 × 7] (S3: tbl_df/tbl/data.frame) ## ..$ date : Date[1:12], format: "2012-01-01" "2012-02-01" ... ## ..$ pce : num [1:12] 10862 10954 10952 10980 10969 ... ## ..$ pop : num [1:12] 313183 313339 313499 313667 313831 ... ## ..$ psavert : num [1:12] 8 8 8.5 8.7 8.8 9.1 8.2 8 8.2 8.8 ... ## ..$ uempmed : num [1:12] 20.8 19.7 19.2 19.1 19.9 20.4 17.5 18.4 18.8 19.9 ... ## ..$ unemploy: num [1:12] 12797 12813 12713 12646 12660 ... ## ..$ year : num [1:12] 2012 2012 2012 2012 2012 ... ## $ 2013: tibble [12 × 7] (S3: tbl_df/tbl/data.frame) ## ..$ date : Date[1:12], format: "2013-01-01" "2013-02-01" ... ## ..$ pce : num [1:12] 11203 11240 11227 11205 11245 ... ## ..$ pop : num [1:12] 315390 315520 315662 315818 315984 ... ## ..$ psavert : num [1:12] 6.3 5.8 5.9 6.4 6.7 6.8 6.6 6.7 6.8 6.3 ... ## ..$ uempmed : num [1:12] 15.8 17.2 17.6 17.1 17.1 17 16.2 16.5 16.5 16.3 ... ## ..$ unemploy: num [1:12] 12471 11950 11689 11760 11654 ... ## ..$ year : num [1:12] 2013 2013 2013 2013 2013 ... ## $ 2014: tibble [12 × 7] (S3: tbl_df/tbl/data.frame) ## ..$ date : Date[1:12], format: "2014-01-01" "2014-02-01" ... ## ..$ pce : num [1:12] 11512 11566 11643 11703 11748 ... ## ..$ pop : num [1:12] 317594 317754 317917 318089 318270 ... ## ..$ psavert : num [1:12] 7.1 7.3 7.4 7.4 7.4 7.4 7.5 7.2 7.4 7.2 ... ## ..$ uempmed : num [1:12] 15.4 15.9 15.8 15.7 14.6 13.8 13.1 12.9 13.4 13.6 ... ## ..$ unemploy: num [1:12] 10202 10349 10380 9702 9859 ... ## ..$ year : num [1:12] 2014 2014 2014 2014 2014 ... ## $ 2015: tibble [4 × 7] (S3: tbl_df/tbl/data.frame) ## ..$ date : Date[1:4], format: "2015-01-01" "2015-02-01" ... ## ..$ pce : num [1:4] 12046 12082 12158 12194 ## ..$ pop : num [1:4] 319929 320075 320231 320402 ## ..$ psavert : num [1:4] 7.7 7.9 7.4 7.6 ## ..$ uempmed : num [1:4] 13.2 12.9 12 11.5 ## ..$ unemploy: num [1:4] 8903 8610 8504 8526 ## ..$ year : num [1:4] 2015 2015 2015 2015 ``` --- # Fit a simple model to each year Notes: * We'll discuss a more elegant way to do this later * This is not (statistically) the best way to approach this problem * It's a good illustration, and in my experience there are lots of times where this approach works well, even if this particular example is a bit artificial --- class: inverse-orange ## What is the relation between personal consumption expenditures (`pce`) and the unemployment percentage over time? -- **Problem:** We don't have the percentage. Let's compute! -- ### You try first! <div class="countdown" id="timer_6227e8f9" style="right:0;bottom:0;" data-warnwhen="0"> <code class="countdown-time"><span class="countdown-digits minutes">04</span><span class="countdown-digits colon">:</span><span class="countdown-digits seconds">00</span></code> </div> --- ```r perc <- map(by_year, ~mutate(.x, percent = unemploy / pop)) str(perc) ``` ``` ## List of 49 ## $ 1967: tibble [6 × 8] (S3: tbl_df/tbl/data.frame) ## ..$ date : Date[1:6], format: "1967-07-01" "1967-08-01" ... ## ..$ pce : num [1:6] 507 510 516 512 517 ... ## ..$ pop : num [1:6] 198712 198911 199113 199311 199498 ... ## ..$ psavert : num [1:6] 12.6 12.6 11.9 12.9 12.8 11.8 ## ..$ uempmed : num [1:6] 4.5 4.7 4.6 4.9 4.7 4.8 ## ..$ unemploy: num [1:6] 2944 2945 2958 3143 3066 ... ## ..$ year : num [1:6] 1967 1967 1967 1967 1967 ... ## ..$ percent : num [1:6] 0.0148 0.0148 0.0149 0.0158 0.0154 ... ## $ 1968: tibble [12 × 8] (S3: tbl_df/tbl/data.frame) ## ..$ date : Date[1:12], format: "1968-01-01" "1968-02-01" ... ## ..$ pce : num [1:12] 531 534 544 544 550 ... ## ..$ pop : num [1:12] 2e+05 2e+05 2e+05 2e+05 2e+05 ... ## ..$ psavert : num [1:12] 11.7 12.3 11.7 12.3 12 11.7 10.7 10.5 10.6 10.8 ... ## ..$ uempmed : num [1:12] 5.1 4.5 4.1 4.6 4.4 4.4 4.5 4.2 4.6 4.8 ... ## ..$ unemploy: num [1:12] 2878 3001 2877 2709 2740 ... ## ..$ year : num [1:12] 1968 1968 1968 1968 1968 ... ## ..$ percent : num [1:12] 0.0144 0.015 0.0144 0.0135 0.0137 ... ## $ 1969: tibble [12 × 8] (S3: tbl_df/tbl/data.frame) ## ..$ date : Date[1:12], format: "1969-01-01" "1969-02-01" ... ## ..$ pce : num [1:12] 584 589 589 594 600 ... ## ..$ pop : num [1:12] 201760 201881 202023 202161 202331 ... ## ..$ psavert : num [1:12] 10.3 9.7 10.2 9.7 10.1 11.1 11.8 11.5 11.6 11.4 ... ## ..$ uempmed : num [1:12] 4.4 4.9 4 4 4.2 4.4 4.4 4.4 4.7 4.5 ... ## ..$ unemploy: num [1:12] 2718 2692 2712 2758 2713 ... ## ..$ year : num [1:12] 1969 1969 1969 1969 1969 ... ## ..$ percent : num [1:12] 0.0135 0.0133 0.0134 0.0136 0.0134 ... ## $ 1970: tibble [12 × 8] (S3: tbl_df/tbl/data.frame) ## ..$ date : Date[1:12], format: "1970-01-01" "1970-02-01" ... ## ..$ pce : num [1:12] 629 634 632 636 642 ... ## ..$ pop : num [1:12] 203849 204008 204156 204401 204607 ... ## ..$ psavert : num [1:12] 11.8 11.7 12.4 13.3 12.4 12.3 13.5 13.4 12.9 13.1 ... ## ..$ uempmed : num [1:12] 4.6 4.5 4.6 4.1 4.7 4.9 5.1 5.4 5.2 5.2 ... ## ..$ unemploy: num [1:12] 3201 3453 3635 3797 3919 ... ## ..$ year : num [1:12] 1970 1970 1970 1970 1970 1970 1970 1970 1970 1970 ... ## ..$ percent : num [1:12] 0.0157 0.0169 0.0178 0.0186 0.0192 ... ## $ 1971: tibble [12 × 8] (S3: tbl_df/tbl/data.frame) ## ..$ date : Date[1:12], format: "1971-01-01" "1971-02-01" ... ## ..$ pce : num [1:12] 676 679 682 689 691 ... ## ..$ pop : num [1:12] 206466 206668 206855 207065 207260 ... ## ..$ psavert : num [1:12] 13.3 13.3 13.5 13.2 13.6 14.7 13.8 13.6 13.3 13.3 ... ## ..$ uempmed : num [1:12] 6.2 6.3 6.4 6.5 6.7 5.7 6.2 6.4 5.8 6.5 ... ## ..$ unemploy: num [1:12] 4986 4903 4987 4959 4996 ... ## ..$ year : num [1:12] 1971 1971 1971 1971 1971 ... ## ..$ percent : num [1:12] 0.0241 0.0237 0.0241 0.0239 0.0241 ... ## $ 1972: tibble [12 × 8] (S3: tbl_df/tbl/data.frame) ## ..$ date : Date[1:12], format: "1972-01-01" "1972-02-01" ... ## ..$ pce : num [1:12] 732 736 749 752 758 ... ## ..$ pop : num [1:12] 208917 209061 209212 209386 209545 ... ## ..$ psavert : num [1:12] 12.5 12.8 11.8 11.5 11.7 11.7 11.7 12 12.2 13 ... ## ..$ uempmed : num [1:12] 6.2 6.6 6.6 6.7 6.6 5.4 6.1 6 5.6 5.7 ... ## ..$ unemploy: num [1:12] 5019 4928 5038 4959 4922 ... ## ..$ year : num [1:12] 1972 1972 1972 1972 1972 ... ## ..$ percent : num [1:12] 0.024 0.0236 0.0241 0.0237 0.0235 ... ## $ 1973: tibble [12 × 8] (S3: tbl_df/tbl/data.frame) ## ..$ date : Date[1:12], format: "1973-01-01" "1973-02-01" ... ## ..$ pce : num [1:12] 816 826 833 836 842 ... ## ..$ pop : num [1:12] 210985 211120 211254 211420 211577 ... ## ..$ psavert : num [1:12] 12.4 12.5 12.7 13.2 13.2 13.6 13.2 13.9 13.1 14.4 ... ## ..$ uempmed : num [1:12] 5.7 5.2 5.5 5 4.9 5 5.2 4.9 5.4 5.5 ... ## ..$ unemploy: num [1:12] 4326 4452 4394 4459 4329 ... ## ..$ year : num [1:12] 1973 1973 1973 1973 1973 ... ## ..$ percent : num [1:12] 0.0205 0.0211 0.0208 0.0211 0.0205 ... ## $ 1974: tibble [12 × 8] (S3: tbl_df/tbl/data.frame) ## ..$ date : Date[1:12], format: "1974-01-01" "1974-02-01" ... ## ..$ pce : num [1:12] 884 890 901 911 922 ... ## ..$ pop : num [1:12] 212932 213074 213211 213361 213513 ... ## ..$ psavert : num [1:12] 14.3 14.2 13.4 13.1 12.8 12.8 12.8 12.1 12.9 13.4 ... ## ..$ uempmed : num [1:12] 5 5.1 4.8 5 4.6 5.3 5.7 5 5.3 5.5 ... ## ..$ unemploy: num [1:12] 4644 4731 4634 4618 4705 ... ## ..$ year : num [1:12] 1974 1974 1974 1974 1974 ... ## ..$ percent : num [1:12] 0.0218 0.0222 0.0217 0.0216 0.022 ... ## $ 1975: tibble [12 × 8] (S3: tbl_df/tbl/data.frame) ## ..$ date : Date[1:12], format: "1975-01-01" "1975-02-01" ... ## ..$ pce : num [1:12] 976 989 991 995 1019 ... ## ..$ pop : num [1:12] 214931 215065 215198 215353 215523 ... ## ..$ psavert : num [1:12] 13.2 12.5 12.7 14.2 17.3 14.3 12.6 13 13 13.4 ... ## ..$ uempmed : num [1:12] 6.3 7.1 7.2 8.7 9.4 8.8 8.6 9.2 9.2 8.6 ... ## ..$ unemploy: num [1:12] 7501 7520 7978 8210 8433 ... ## ..$ year : num [1:12] 1975 1975 1975 1975 1975 ... ## ..$ percent : num [1:12] 0.0349 0.035 0.0371 0.0381 0.0391 ... ## $ 1976: tibble [12 × 8] (S3: tbl_df/tbl/data.frame) ## ..$ date : Date[1:12], format: "1976-01-01" "1976-02-01" ... ## ..$ pce : num [1:12] 1107 1108 1115 1125 1123 ... ## ..$ pop : num [1:12] 217095 217249 217381 217528 217685 ... ## ..$ psavert : num [1:12] 11.7 12.3 12.2 11.7 12.3 11.4 11.7 11.7 11.4 11.1 ... ## ..$ uempmed : num [1:12] 9 8.2 8.7 8.2 8.3 7.8 7.7 7.9 7.8 7.7 ... ## ..$ unemploy: num [1:12] 7534 7326 7230 7330 7053 ... ## ..$ year : num [1:12] 1976 1976 1976 1976 1976 ... ## ..$ percent : num [1:12] 0.0347 0.0337 0.0333 0.0337 0.0324 ... ## $ 1977: tibble [12 × 8] (S3: tbl_df/tbl/data.frame) ## ..$ date : Date[1:12], format: "1977-01-01" "1977-02-01" ... ## ..$ pce : num [1:12] 1215 1231 1238 1247 1257 ... ## ..$ pop : num [1:12] 219179 219344 219504 219684 219859 ... ## ..$ psavert : num [1:12] 10.6 9.3 10.5 10.5 10.3 10.6 10.5 10.9 11.1 11 ... ## ..$ uempmed : num [1:12] 7.5 7.2 7.2 7.3 7.9 6.2 7.1 7 6.7 6.9 ... ## ..$ unemploy: num [1:12] 7280 7443 7307 7059 6911 ... ## ..$ year : num [1:12] 1977 1977 1977 1977 1977 ... ## ..$ percent : num [1:12] 0.0332 0.0339 0.0333 0.0321 0.0314 ... ## $ 1978: tibble [12 × 8] (S3: tbl_df/tbl/data.frame) ## ..$ date : Date[1:12], format: "1978-01-01" "1978-02-01" ... ## ..$ pce : num [1:12] 1330 1355 1378 1396 1412 ... ## ..$ pop : num [1:12] 221477 221629 221792 221991 222176 ... ## ..$ psavert : num [1:12] 11.9 11.1 11 10.8 10.3 10 10.9 10.5 10.6 10.7 ... ## ..$ uempmed : num [1:12] 6.5 6.7 6.2 6.1 5.7 6 5.8 5.8 5.6 5.9 ... ## ..$ unemploy: num [1:12] 6489 6318 6337 6180 6127 ... ## ..$ year : num [1:12] 1978 1978 1978 1978 1978 ... ## ..$ percent : num [1:12] 0.0293 0.0285 0.0286 0.0278 0.0276 ... ## $ 1979: tibble [12 × 8] (S3: tbl_df/tbl/data.frame) ## ..$ date : Date[1:12], format: "1979-01-01" "1979-02-01" ... ## ..$ pce : num [1:12] 1502 1518 1531 1538 1559 ... ## ..$ pop : num [1:12] 223865 224053 224235 224438 224632 ... ## ..$ psavert : num [1:12] 11.1 11.1 11.2 11 10.3 9.9 10.6 9.7 9.4 9.7 ... ## ..$ uempmed : num [1:12] 5.9 5.9 5.9 5.4 5.6 5.6 5.9 4.8 5.5 5.5 ... ## ..$ unemploy: num [1:12] 6109 6173 6109 6069 5840 ... ## ..$ year : num [1:12] 1979 1979 1979 1979 1979 ... ## ..$ percent : num [1:12] 0.0273 0.0276 0.0272 0.027 0.026 ... ## $ 1980: tibble [12 × 8] (S3: tbl_df/tbl/data.frame) ## ..$ date : Date[1:12], format: "1980-01-01" "1980-02-01" ... ## ..$ pce : num [1:12] 1697 1701 1708 1695 1700 ... ## ..$ pop : num [1:12] 226451 226656 226849 227061 227251 ... ## ..$ psavert : num [1:12] 9.9 10.1 10.2 11.3 11.4 11.2 11.3 11.3 11.7 11.3 ... ## ..$ uempmed : num [1:12] 5.3 5.8 6 5.8 5.7 6.4 7 7.5 7.7 7.5 ... ## ..$ unemploy: num [1:12] 6683 6702 6729 7358 7984 ... ## ..$ year : num [1:12] 1980 1980 1980 1980 1980 1980 1980 1980 1980 1980 ... ## ..$ percent : num [1:12] 0.0295 0.0296 0.0297 0.0324 0.0351 ... ## $ 1981: tibble [12 × 8] (S3: tbl_df/tbl/data.frame) ## ..$ date : Date[1:12], format: "1981-01-01" "1981-02-01" ... ## ..$ pce : num [1:12] 1870 1884 1903 1904 1914 ... ## ..$ pop : num [1:12] 228937 229071 229224 229403 229575 ... ## ..$ psavert : num [1:12] 10.9 10.8 10.8 10.9 11 10.8 12.3 12 12.4 13 ... ## ..$ uempmed : num [1:12] 7.4 7.1 7.1 7.4 6.9 6.6 7.1 7.2 6.8 6.8 ... ## ..$ unemploy: num [1:12] 8071 8051 7982 7869 8174 ... ## ..$ year : num [1:12] 1981 1981 1981 1981 1981 ... ## ..$ percent : num [1:12] 0.0353 0.0351 0.0348 0.0343 0.0356 ... ## $ 1982: tibble [12 × 8] (S3: tbl_df/tbl/data.frame) ## ..$ date : Date[1:12], format: "1982-01-01" "1982-02-01" ... ## ..$ pce : num [1:12] 1997 2021 2024 2026 2044 ... ## ..$ pop : num [1:12] 231157 231313 231470 231645 231809 ... ## ..$ psavert : num [1:12] 12.7 12.1 12.2 12.9 12.3 12.3 12.5 12.6 11.8 11.3 ... ## ..$ uempmed : num [1:12] 7.1 7.5 7.7 8.1 8.5 9.5 8.5 8.7 9.5 9.7 ... ## ..$ unemploy: num [1:12] 9397 9705 9895 10244 10335 ... ## ..$ year : num [1:12] 1982 1982 1982 1982 1982 ... ## ..$ percent : num [1:12] 0.0407 0.042 0.0427 0.0442 0.0446 ... ## $ 1983: tibble [12 × 8] (S3: tbl_df/tbl/data.frame) ## ..$ date : Date[1:12], format: "1983-01-01" "1983-02-01" ... ## ..$ pce : num [1:12] 2174 2177 2203 2226 2246 ... ## ..$ pop : num [1:12] 233322 233473 233613 233781 233922 ... ## ..$ psavert : num [1:12] 11.1 11.1 10.6 10.3 9.9 9.1 9.6 9.2 9.6 9.7 ... ## ..$ uempmed : num [1:12] 11.1 9.8 10.4 10.9 12.3 11.3 10.1 9.3 9.3 9.4 ... ## ..$ unemploy: num [1:12] 11534 11545 11408 11268 11154 ... ## ..$ year : num [1:12] 1983 1983 1983 1983 1983 ... ## ..$ percent : num [1:12] 0.0494 0.0494 0.0488 0.0482 0.0477 ... ## $ 1984: tibble [12 × 8] (S3: tbl_df/tbl/data.frame) ## ..$ date : Date[1:12], format: "1984-01-01" "1984-02-01" ... ## ..$ pce : num [1:12] 2419 2404 2432 2458 2474 ... ## ..$ pop : num [1:12] 235385 235527 235675 235839 235993 ... ## ..$ psavert : num [1:12] 10 11.7 11.5 11.5 11.1 11.1 11.6 11.8 11.8 11.7 ... ## ..$ uempmed : num [1:12] 9.1 8.3 8.3 8.2 9.1 7.5 7.5 7.3 7.6 7.2 ... ## ..$ unemploy: num [1:12] 9008 8791 8746 8762 8456 ... ## ..$ year : num [1:12] 1984 1984 1984 1984 1984 ... ## ..$ percent : num [1:12] 0.0383 0.0373 0.0371 0.0372 0.0358 ... ## $ 1985: tibble [12 × 8] (S3: tbl_df/tbl/data.frame) ## ..$ date : Date[1:12], format: "1985-01-01" "1985-02-01" ... ## ..$ pce : num [1:12] 2619 2641 2648 2660 2696 ... ## ..$ pop : num [1:12] 237468 237602 237732 237900 238074 ... ## ..$ psavert : num [1:12] 10.3 9.1 8.7 9.9 11.1 9.6 9.1 8.2 7.3 9.1 ... ## ..$ uempmed : num [1:12] 6.8 7.1 7.1 6.9 6.9 6.6 6.9 7.1 6.9 7.1 ... ## ..$ unemploy: num [1:12] 8423 8321 8339 8395 8302 ... ## ..$ year : num [1:12] 1985 1985 1985 1985 1985 ... ## ..$ percent : num [1:12] 0.0355 0.035 0.0351 0.0353 0.0349 ... ## $ 1986: tibble [12 × 8] (S3: tbl_df/tbl/data.frame) ## ..$ date : Date[1:12], format: "1986-01-01" "1986-02-01" ... ## ..$ pce : num [1:12] 2827 2820 2824 2835 2858 ... ## ..$ pop : num [1:12] 239638 239788 239928 240094 240271 ... ## ..$ psavert : num [1:12] 8.6 9.3 9.9 9.7 9.3 9.4 9.3 9 7.2 8.4 ... ## ..$ uempmed : num [1:12] 6.7 6.9 6.8 6.7 6.8 7 6.9 7.1 7.4 7 ... ## ..$ unemploy: num [1:12] 7795 8402 8383 8364 8439 ... ## ..$ year : num [1:12] 1986 1986 1986 1986 1986 ... ## ..$ percent : num [1:12] 0.0325 0.035 0.0349 0.0348 0.0351 ... ## $ 1987: tibble [12 × 8] (S3: tbl_df/tbl/data.frame) ## ..$ date : Date[1:12], format: "1987-01-01" "1987-02-01" ... ## ..$ pce : num [1:12] 2936 3002 3013 3039 3048 ... ## ..$ pop : num [1:12] 241784 241930 242079 242252 242423 ... ## ..$ psavert : num [1:12] 9.7 8.5 8.5 4.5 8.2 7.7 7.5 7.2 7.6 8.3 ... ## ..$ uempmed : num [1:12] 6.9 6.6 6.6 7.1 6.6 6.5 6.5 6.4 6 6.3 ... ## ..$ unemploy: num [1:12] 7892 7865 7862 7542 7574 ... ## ..$ year : num [1:12] 1987 1987 1987 1987 1987 ... ## ..$ percent : num [1:12] 0.0326 0.0325 0.0325 0.0311 0.0312 ... ## $ 1988: tibble [12 × 8] (S3: tbl_df/tbl/data.frame) ## ..$ date : Date[1:12], format: "1988-01-01" "1988-02-01" ... ## ..$ pce : num [1:12] 3214 3221 3260 3263 3294 ... ## ..$ pop : num [1:12] 243981 244131 244279 244445 244610 ... ## ..$ psavert : num [1:12] 8.1 8.6 8.2 8.8 8.4 8.4 8.6 8.4 8.9 8.6 ... ## ..$ uempmed : num [1:12] 6.2 6.3 6.4 5.9 5.9 5.8 6.1 5.9 5.7 5.6 ... ## ..$ unemploy: num [1:12] 6953 6929 6876 6601 6779 ... ## ..$ year : num [1:12] 1988 1988 1988 1988 1988 ... ## ..$ percent : num [1:12] 0.0285 0.0284 0.0281 0.027 0.0277 ... ## $ 1989: tibble [12 × 8] (S3: tbl_df/tbl/data.frame) ## ..$ date : Date[1:12], format: "1989-01-01" "1989-02-01" ... ## ..$ pce : num [1:12] 3484 3488 3499 3543 3552 ... ## ..$ pop : num [1:12] 246224 246378 246530 246721 246906 ... ## ..$ psavert : num [1:12] 8.5 9 9.5 8.4 8.1 8.2 8.2 7.6 8.1 8.5 ... ## ..$ uempmed : num [1:12] 5.6 5.4 5.4 5.4 5.3 5.4 5.6 5 4.9 4.9 ... ## ..$ unemploy: num [1:12] 6682 6359 6205 6468 6375 ... ## ..$ year : num [1:12] 1989 1989 1989 1989 1989 ... ## ..$ percent : num [1:12] 0.0271 0.0258 0.0252 0.0262 0.0258 ... ## $ 1990: tibble [12 × 8] (S3: tbl_df/tbl/data.frame) ## ..$ date : Date[1:12], format: "1990-01-01" "1990-02-01" ... ## ..$ pce : num [1:12] 3731 3728 3755 3770 3776 ... ## ..$ pop : num [1:12] 248659 248827 249012 249306 249565 ... ## ..$ psavert : num [1:12] 8 8.6 8.3 8.8 8.7 8.6 8.7 8.1 8.1 7.8 ... ## ..$ uempmed : num [1:12] 5.1 5.3 5.1 4.8 5.2 5.2 5.4 5.4 5.6 5.8 ... ## ..$ unemploy: num [1:12] 6752 6651 6598 6797 6742 ... ## ..$ year : num [1:12] 1990 1990 1990 1990 1990 1990 1990 1990 1990 1990 ... ## ..$ percent : num [1:12] 0.0272 0.0267 0.0265 0.0273 0.027 ... ## $ 1991: tibble [12 × 8] (S3: tbl_df/tbl/data.frame) ## ..$ date : Date[1:12], format: "1991-01-01" "1991-02-01" ... ## ..$ pce : num [1:12] 3841 3867 3913 3907 3933 ... ## ..$ pop : num [1:12] 251889 252135 252372 252643 252913 ... ## ..$ psavert : num [1:12] 9.3 8.8 8 8.6 8.4 8.9 8.2 8.6 8.8 9.3 ... ## ..$ uempmed : num [1:12] 6 6.2 6.7 6.6 6.4 6.9 7 7.3 6.8 7.2 ... ## ..$ unemploy: num [1:12] 8015 8265 8586 8439 8736 ... ## ..$ year : num [1:12] 1991 1991 1991 1991 1991 ... ## ..$ percent : num [1:12] 0.0318 0.0328 0.034 0.0334 0.0345 ... ## $ 1992: tibble [12 × 8] (S3: tbl_df/tbl/data.frame) ## ..$ date : Date[1:12], format: "1992-01-01" "1992-02-01" ... ## ..$ pce : num [1:12] 4085 4100 4117 4132 4158 ... ## ..$ pop : num [1:12] 255214 255448 255703 255992 256285 ... ## ..$ psavert : num [1:12] 9.4 9.8 9.7 9.9 9.9 10.1 9.6 9.7 8.7 8 ... ## ..$ uempmed : num [1:12] 8.1 8.2 8.3 8.5 8.8 8.7 8.6 8.8 8.6 9 ... ## ..$ unemploy: num [1:12] 9283 9454 9460 9415 9744 ... ## ..$ year : num [1:12] 1992 1992 1992 1992 1992 ... ## ..$ percent : num [1:12] 0.0364 0.037 0.037 0.0368 0.038 ... ## $ 1993: tibble [12 × 8] (S3: tbl_df/tbl/data.frame) ## ..$ date : Date[1:12], format: "1993-01-01" "1993-02-01" ... ## ..$ pce : num [1:12] 4341 4355 4352 4393 4422 ... ## ..$ pop : num [1:12] 258679 258919 259152 259414 259680 ... ## ..$ psavert : num [1:12] 8.6 8.9 8.9 8.7 8.3 7.8 7.6 7.7 6.9 6.3 ... ## ..$ uempmed : num [1:12] 8.6 8.5 8.5 8.4 8.1 8.3 8.2 8.2 8.3 8 ... ## ..$ unemploy: num [1:12] 9325 9183 9056 9110 9149 ... ## ..$ year : num [1:12] 1993 1993 1993 1993 1993 ... ## ..$ percent : num [1:12] 0.036 0.0355 0.0349 0.0351 0.0352 ... ## $ 1994: tibble [12 × 8] (S3: tbl_df/tbl/data.frame) ## ..$ date : Date[1:12], format: "1994-01-01" "1994-02-01" ... ## ..$ pce : num [1:12] 4585 4633 4646 4671 4670 ... ## ..$ pop : num [1:12] 261919 262123 262352 262631 262877 ... ## ..$ psavert : num [1:12] 7.1 6.5 6.8 6.4 7.6 6.9 7 6.5 6.8 7.1 ... ## ..$ uempmed : num [1:12] 8.6 9.2 9.3 9.1 9.2 9.3 9 8.9 9.2 10 ... ## ..$ unemploy: num [1:12] 8630 8583 8470 8331 7915 ... ## ..$ year : num [1:12] 1994 1994 1994 1994 1994 ... ## ..$ percent : num [1:12] 0.0329 0.0327 0.0323 0.0317 0.0301 ... ## $ 1995: tibble [12 × 8] (S3: tbl_df/tbl/data.frame) ## ..$ date : Date[1:12], format: "1995-01-01" "1995-02-01" ... ## ..$ pce : num [1:12] 4851 4851 4885 4890 4933 ... ## ..$ pop : num [1:12] 265044 265270 265495 265755 265998 ... ## ..$ psavert : num [1:12] 7.5 7.8 7.5 6.9 7.1 6.7 7.1 6.7 6.8 7.1 ... ## ..$ uempmed : num [1:12] 8 8.1 8.3 8.3 9.1 7.9 8.5 8.3 7.9 8.2 ... ## ..$ unemploy: num [1:12] 7375 7187 7153 7645 7430 ... ## ..$ year : num [1:12] 1995 1995 1995 1995 1995 ... ## ..$ percent : num [1:12] 0.0278 0.0271 0.0269 0.0288 0.0279 ... ## $ 1996: tibble [12 × 8] (S3: tbl_df/tbl/data.frame) ## ..$ date : Date[1:12], format: "1996-01-01" "1996-02-01" ... ## ..$ pce : num [1:12] 5086 5133 5173 5208 5224 ... ## ..$ pop : num [1:12] 268151 268364 268595 268853 269108 ... ## ..$ psavert : num [1:12] 6.7 6.7 6.6 5.7 6.7 7.1 6.7 6.6 6.7 6.4 ... ## ..$ uempmed : num [1:12] 8.3 7.8 8.3 8.6 8.6 8.3 8.3 8.4 8.5 8.3 ... ## ..$ unemploy: num [1:12] 7491 7313 7318 7415 7423 ... ## ..$ year : num [1:12] 1996 1996 1996 1996 1996 ... ## ..$ percent : num [1:12] 0.0279 0.0273 0.0272 0.0276 0.0276 ... ## $ 1997: tibble [12 × 8] (S3: tbl_df/tbl/data.frame) ## ..$ date : Date[1:12], format: "1997-01-01" "1997-02-01" ... ## ..$ pce : num [1:12] 5411 5434 5454 5459 5460 ... ## ..$ pop : num [1:12] 271360 271585 271821 272083 272342 ... ## ..$ psavert : num [1:12] 6.2 6.2 6.4 6.5 6.8 6.6 6.1 6 6.2 6.2 ... ## ..$ uempmed : num [1:12] 7.8 8.1 7.9 8.3 8 8 8.3 7.8 8.2 7.7 ... ## ..$ unemploy: num [1:12] 7158 7102 7000 6873 6655 ... ## ..$ year : num [1:12] 1997 1997 1997 1997 1997 ... ## ..$ percent : num [1:12] 0.0264 0.0262 0.0258 0.0253 0.0244 ... ## $ 1998: tibble [12 × 8] (S3: tbl_df/tbl/data.frame) ## ..$ date : Date[1:12], format: "1998-01-01" "1998-02-01" ... ## ..$ pce : num [1:12] 5690 5724 5750 5788 5838 ... ## ..$ pop : num [1:12] 274626 274838 275047 275304 275564 ... ## ..$ psavert : num [1:12] 7.4 7.4 7.5 7.2 6.9 6.8 6.9 6.8 6.4 6.2 ... ## ..$ uempmed : num [1:12] 7.4 7 6.8 6.7 6 6.9 6.7 6.8 6.7 5.8 ... ## ..$ unemploy: num [1:12] 6368 6306 6422 5941 6047 ... ## ..$ year : num [1:12] 1998 1998 1998 1998 1998 ... ## ..$ percent : num [1:12] 0.0232 0.0229 0.0233 0.0216 0.0219 ... ## $ 1999: tibble [12 × 8] (S3: tbl_df/tbl/data.frame) ## ..$ date : Date[1:12], format: "1999-01-01" "1999-02-01" ... ## ..$ pce : num [1:12] 6073 6102 6133 6196 6226 ... ## ..$ pop : num [1:12] 277790 277992 278198 278451 278717 ... ## ..$ psavert : num [1:12] 6.4 6.2 5.9 5.2 4.9 4.8 4.8 4.7 4.2 4.6 ... ## ..$ uempmed : num [1:12] 6.9 6.8 6.8 6.2 6.5 6.3 5.8 6.5 6 6.1 ... ## ..$ unemploy: num [1:12] 5976 6111 5783 6004 5796 ... ## ..$ year : num [1:12] 1999 1999 1999 1999 1999 ... ## ..$ percent : num [1:12] 0.0215 0.022 0.0208 0.0216 0.0208 ... ## $ 2000: tibble [12 × 8] (S3: tbl_df/tbl/data.frame) ## ..$ date : Date[1:12], format: "2000-01-01" "2000-02-01" ... ## ..$ pce : num [1:12] 6535 6620 6686 6671 6708 ... ## ..$ pop : num [1:12] 280976 281190 281409 281653 281877 ... ## ..$ psavert : num [1:12] 5.4 4.8 4.5 5 4.9 4.9 5.2 5.2 4.5 4.6 ... ## ..$ uempmed : num [1:12] 5.8 6.1 6 6.1 5.8 5.7 6 6.3 5.2 6.1 ... ## ..$ unemploy: num [1:12] 5708 5858 5733 5481 5758 ... ## ..$ year : num [1:12] 2000 2000 2000 2000 2000 2000 2000 2000 2000 2000 ... ## ..$ percent : num [1:12] 0.0203 0.0208 0.0204 0.0195 0.0204 ... ## $ 2001: tibble [12 × 8] (S3: tbl_df/tbl/data.frame) ## ..$ date : Date[1:12], format: "2001-01-01" "2001-02-01" ... ## ..$ pce : num [1:12] 6977 6996 6988 7001 7047 ... ## ..$ pop : num [1:12] 283920 284137 284350 284581 284810 ... ## ..$ psavert : num [1:12] 4.8 4.9 5.3 5 4.5 4.5 5.6 6.8 7 3.4 ... ## ..$ uempmed : num [1:12] 5.8 6.1 6.6 5.9 6.3 6 6.8 6.9 7.2 7.3 ... ## ..$ unemploy: num [1:12] 6023 6089 6141 6271 6226 ... ## ..$ year : num [1:12] 2001 2001 2001 2001 2001 ... ## ..$ percent : num [1:12] 0.0212 0.0214 0.0216 0.022 0.0219 ... ## $ 2002: tibble [12 × 8] (S3: tbl_df/tbl/data.frame) ## ..$ date : Date[1:12], format: "2002-01-01" "2002-02-01" ... ## ..$ pce : num [1:12] 7174 7218 7237 7305 7283 ... ## ..$ pop : num [1:12] 286788 286994 287190 287397 287623 ... ## ..$ psavert : num [1:12] 6.1 5.8 5.9 5.8 6.5 6.4 5.5 5.4 5.7 5.7 ... ## ..$ uempmed : num [1:12] 8.4 8.3 8.4 8.9 9.5 11 8.9 9 9.5 9.6 ... ## ..$ unemploy: num [1:12] 8182 8215 8304 8599 8399 ... ## ..$ year : num [1:12] 2002 2002 2002 2002 2002 ... ## ..$ percent : num [1:12] 0.0285 0.0286 0.0289 0.0299 0.0292 ... ## $ 2003: tibble [12 × 8] (S3: tbl_df/tbl/data.frame) ## ..$ date : Date[1:12], format: "2003-01-01" "2003-02-01" ... ## ..$ pce : num [1:12] 7533 7536 7598 7621 7628 ... ## ..$ pop : num [1:12] 289518 289714 289911 290125 290346 ... ## ..$ psavert : num [1:12] 5.5 5.6 5.3 5.3 5.8 5.6 6.3 6 5.2 5.3 ... ## ..$ uempmed : num [1:12] 9.6 9.5 9.7 10.2 9.9 11.5 10.3 10.1 10.2 10.4 ... ## ..$ unemploy: num [1:12] 8520 8618 8588 8842 8957 ... ## ..$ year : num [1:12] 2003 2003 2003 2003 2003 ... ## ..$ percent : num [1:12] 0.0294 0.0297 0.0296 0.0305 0.0308 ... ## $ 2004: tibble [12 × 8] (S3: tbl_df/tbl/data.frame) ## ..$ date : Date[1:12], format: "2004-01-01" "2004-02-01" ... ## ..$ pce : num [1:12] 7987 8020 8076 8089 8163 ... ## ..$ pop : num [1:12] 292192 292368 292561 292779 292997 ... ## ..$ psavert : num [1:12] 5 5 4.9 5.3 5.3 5.8 5.3 5.2 4.6 4.5 ... ## ..$ uempmed : num [1:12] 10.6 10.2 10.2 9.5 9.9 11 8.9 9.2 9.6 9.5 ... ## ..$ unemploy: num [1:12] 8370 8167 8491 8170 8212 ... ## ..$ year : num [1:12] 2004 2004 2004 2004 2004 ... ## ..$ percent : num [1:12] 0.0286 0.0279 0.029 0.0279 0.028 ... ## $ 2005: tibble [12 × 8] (S3: tbl_df/tbl/data.frame) ## ..$ date : Date[1:12], format: "2005-01-01" "2005-02-01" ... ## ..$ pce : num [1:12] 8470 8529 8570 8646 8644 ... ## ..$ pop : num [1:12] 294914 295105 295287 295490 295704 ... ## ..$ psavert : num [1:12] 3.7 3.4 3.6 3.1 3.5 2.9 2.2 2.7 2.7 3.1 ... ## ..$ uempmed : num [1:12] 9.4 9.2 9.3 9 9.1 9 8.8 9.2 8.4 8.6 ... ## ..$ unemploy: num [1:12] 7784 7980 7737 7672 7651 ... ## ..$ year : num [1:12] 2005 2005 2005 2005 2005 ... ## ..$ percent : num [1:12] 0.0264 0.027 0.0262 0.026 0.0259 ... ## $ 2006: tibble [12 × 8] (S3: tbl_df/tbl/data.frame) ## ..$ date : Date[1:12], format: "2006-01-01" "2006-02-01" ... ## ..$ pce : num [1:12] 9060 9090 9122 9175 9215 ... ## ..$ pop : num [1:12] 297647 297854 298060 298281 298496 ... ## ..$ psavert : num [1:12] 4.2 4.2 4.2 4 3.8 4 3.4 3.6 3.6 3.6 ... ## ..$ uempmed : num [1:12] 8.6 9.1 8.7 8.4 8.5 7.3 8 8.4 8 7.9 ... ## ..$ unemploy: num [1:12] 7064 7184 7072 7120 6980 ... ## ..$ year : num [1:12] 2006 2006 2006 2006 2006 ... ## ..$ percent : num [1:12] 0.0237 0.0241 0.0237 0.0239 0.0234 ... ## $ 2007: tibble [12 × 8] (S3: tbl_df/tbl/data.frame) ## ..$ date : Date[1:12], format: "2007-01-01" "2007-02-01" ... ## ..$ pce : num [1:12] 9516 9547 9585 9616 9651 ... ## ..$ pop : num [1:12] 300574 300802 301021 301254 301483 ... ## ..$ psavert : num [1:12] 3.7 4.1 4.4 4.2 4 3.8 3.7 3.4 3.5 3.4 ... ## ..$ uempmed : num [1:12] 8.3 8.5 9.1 8.6 8.2 7.7 8.7 8.8 8.7 8.4 ... ## ..$ unemploy: num [1:12] 7116 6927 6731 6850 6766 ... ## ..$ year : num [1:12] 2007 2007 2007 2007 2007 ... ## ..$ percent : num [1:12] 0.0237 0.023 0.0224 0.0227 0.0224 ... ## $ 2008: tibble [12 × 8] (S3: tbl_df/tbl/data.frame) ## ..$ date : Date[1:12], format: "2008-01-01" "2008-02-01" ... ## ..$ pce : num [1:12] 9930 9913 9959 9997 10054 ... ## ..$ pop : num [1:12] 303506 303711 303907 304117 304323 ... ## ..$ psavert : num [1:12] 3.7 4.1 4 3.4 7.8 5.5 4.4 3.8 4.7 5.5 ... ## ..$ uempmed : num [1:12] 9 8.7 8.7 9.4 7.9 9 9.7 9.7 10.2 10.4 ... ## ..$ unemploy: num [1:12] 7685 7497 7822 7637 8395 ... ## ..$ year : num [1:12] 2008 2008 2008 2008 2008 ... ## ..$ percent : num [1:12] 0.0253 0.0247 0.0257 0.0251 0.0276 ... ## $ 2009: tibble [12 × 8] (S3: tbl_df/tbl/data.frame) ## ..$ date : Date[1:12], format: "2009-01-01" "2009-02-01" ... ## ..$ pce : num [1:12] 9784 9766 9718 9725 9749 ... ## ..$ pop : num [1:12] 306208 306402 306588 306787 306984 ... ## ..$ psavert : num [1:12] 6.2 5.5 5.9 6.8 8.2 6.7 6 4.9 5.9 5.4 ... ## ..$ uempmed : num [1:12] 10.7 11.7 12.3 13.1 14.2 17.2 16 16.3 17.8 18.9 ... ## ..$ unemploy: num [1:12] 12058 12898 13426 13853 14499 ... ## ..$ year : num [1:12] 2009 2009 2009 2009 2009 ... ## ..$ percent : num [1:12] 0.0394 0.0421 0.0438 0.0452 0.0472 ... ## $ 2010: tibble [12 × 8] (S3: tbl_df/tbl/data.frame) ## ..$ date : Date[1:12], format: "2010-01-01" "2010-02-01" ... ## ..$ pce : num [1:12] 10002 10031 10089 10113 10131 ... ## ..$ pop : num [1:12] 308833 309027 309212 309191 309369 ... ## ..$ psavert : num [1:12] 6.1 5.8 5.7 6.4 7 6.9 6.8 6.9 6.7 6.6 ... ## ..$ uempmed : num [1:12] 20 19.9 20.4 22.1 22.3 25.2 22.3 21 20.3 21.2 ... ## ..$ unemploy: num [1:12] 15046 15113 15202 15325 14849 ... ## ..$ year : num [1:12] 2010 2010 2010 2010 2010 2010 2010 2010 2010 2010 ... ## ..$ percent : num [1:12] 0.0487 0.0489 0.0492 0.0496 0.048 ... ## $ 2011: tibble [12 × 8] (S3: tbl_df/tbl/data.frame) ## ..$ date : Date[1:12], format: "2011-01-01" "2011-02-01" ... ## ..$ pce : num [1:12] 10436 10470 10550 10588 10612 ... ## ..$ pop : num [1:12] 310961 311113 311265 311436 311607 ... ## ..$ psavert : num [1:12] 7.4 7.6 7 6.9 6.9 7.2 7.3 7.2 6.8 6.8 ... ## ..$ uempmed : num [1:12] 21.5 21.1 21.5 20.9 21.6 22.4 22 22.4 22 20.6 ... ## ..$ unemploy: num [1:12] 14013 13820 13737 13957 13855 ... ## ..$ year : num [1:12] 2011 2011 2011 2011 2011 ... ## ..$ percent : num [1:12] 0.0451 0.0444 0.0441 0.0448 0.0445 ... ## $ 2012: tibble [12 × 8] (S3: tbl_df/tbl/data.frame) ## ..$ date : Date[1:12], format: "2012-01-01" "2012-02-01" ... ## ..$ pce : num [1:12] 10862 10954 10952 10980 10969 ... ## ..$ pop : num [1:12] 313183 313339 313499 313667 313831 ... ## ..$ psavert : num [1:12] 8 8 8.5 8.7 8.8 9.1 8.2 8 8.2 8.8 ... ## ..$ uempmed : num [1:12] 20.8 19.7 19.2 19.1 19.9 20.4 17.5 18.4 18.8 19.9 ... ## ..$ unemploy: num [1:12] 12797 12813 12713 12646 12660 ... ## ..$ year : num [1:12] 2012 2012 2012 2012 2012 ... ## ..$ percent : num [1:12] 0.0409 0.0409 0.0406 0.0403 0.0403 ... ## $ 2013: tibble [12 × 8] (S3: tbl_df/tbl/data.frame) ## ..$ date : Date[1:12], format: "2013-01-01" "2013-02-01" ... ## ..$ pce : num [1:12] 11203 11240 11227 11205 11245 ... ## ..$ pop : num [1:12] 315390 315520 315662 315818 315984 ... ## ..$ psavert : num [1:12] 6.3 5.8 5.9 6.4 6.7 6.8 6.6 6.7 6.8 6.3 ... ## ..$ uempmed : num [1:12] 15.8 17.2 17.6 17.1 17.1 17 16.2 16.5 16.5 16.3 ... ## ..$ unemploy: num [1:12] 12471 11950 11689 11760 11654 ... ## ..$ year : num [1:12] 2013 2013 2013 2013 2013 ... ## ..$ percent : num [1:12] 0.0395 0.0379 0.037 0.0372 0.0369 ... ## $ 2014: tibble [12 × 8] (S3: tbl_df/tbl/data.frame) ## ..$ date : Date[1:12], format: "2014-01-01" "2014-02-01" ... ## ..$ pce : num [1:12] 11512 11566 11643 11703 11748 ... ## ..$ pop : num [1:12] 317594 317754 317917 318089 318270 ... ## ..$ psavert : num [1:12] 7.1 7.3 7.4 7.4 7.4 7.4 7.5 7.2 7.4 7.2 ... ## ..$ uempmed : num [1:12] 15.4 15.9 15.8 15.7 14.6 13.8 13.1 12.9 13.4 13.6 ... ## ..$ unemploy: num [1:12] 10202 10349 10380 9702 9859 ... ## ..$ year : num [1:12] 2014 2014 2014 2014 2014 ... ## ..$ percent : num [1:12] 0.0321 0.0326 0.0327 0.0305 0.031 ... ## $ 2015: tibble [4 × 8] (S3: tbl_df/tbl/data.frame) ## ..$ date : Date[1:4], format: "2015-01-01" "2015-02-01" ... ## ..$ pce : num [1:4] 12046 12082 12158 12194 ## ..$ pop : num [1:4] 319929 320075 320231 320402 ## ..$ psavert : num [1:4] 7.7 7.9 7.4 7.6 ## ..$ uempmed : num [1:4] 13.2 12.9 12 11.5 ## ..$ unemploy: num [1:4] 8903 8610 8504 8526 ## ..$ year : num [1:4] 2015 2015 2015 2015 ## ..$ percent : num [1:4] 0.0278 0.0269 0.0266 0.0266 ``` --- # Fit the models Fit a model of the form `lm(percent ~ pce)` to each year ### You try first! <div class="countdown" id="timer_6227ea7d" style="right:0;bottom:0;" data-warnwhen="0"> <code class="countdown-time"><span class="countdown-digits minutes">03</span><span class="countdown-digits colon">:</span><span class="countdown-digits seconds">00</span></code> </div> -- ```r mods <- map(perc, ~lm(percent ~ pce, data = .x)) str(mods) ``` ``` ## List of 49 ## $ 1967:List of 12 ## ..$ coefficients : Named num [1:2] 8.40e-03 1.31e-05 ## .. ..- attr(*, "names")= chr [1:2] "(Intercept)" "pce" ## ..$ residuals : Named num [1:6] -0.000205 -0.000255 -0.000281 0.000677 0.000208 ... ## .. ..- attr(*, "names")= chr [1:6] "1" "2" "3" "4" ... ## ..$ effects : Named num [1:6] -0.037041 0.00019 -0.000261 0.000737 0.000208 ... ## .. ..- attr(*, "names")= chr [1:6] "(Intercept)" "pce" "" "" ... ## ..$ rank : int 2 ## ..$ fitted.values: Named num [1:6] 0.015 0.0151 0.0151 0.0151 0.0152 ... ## .. ..- attr(*, "names")= chr [1:6] "1" "2" "3" "4" ... ## ..$ assign : int [1:2] 0 1 ## ..$ qr :List of 5 ## .. ..$ qr : num [1:6, 1:2] -2.449 0.408 0.408 0.408 0.408 ... ## .. .. ..- attr(*, "dimnames")=List of 2 ## .. .. .. ..$ : chr [1:6] "1" "2" "3" "4" ... ## .. .. .. ..$ : chr [1:2] "(Intercept)" "pce" ## .. .. ..- attr(*, "assign")= int [1:2] 0 1 ## .. ..$ qraux: num [1:2] 1.41 1.17 ## .. ..$ pivot: int [1:2] 1 2 ## .. ..$ tol : num 1e-07 ## .. ..$ rank : int 2 ## .. ..- attr(*, "class")= chr "qr" ## ..$ df.residual : int 4 ## ..$ xlevels : Named list() ## ..$ call : language lm(formula = percent ~ pce, data = .x) ## ..$ terms :Classes 'terms', 'formula' language percent ~ pce ## .. .. ..- attr(*, "variables")= language list(percent, pce) ## .. .. ..- attr(*, "factors")= int [1:2, 1] 0 1 ## .. .. .. ..- attr(*, "dimnames")=List of 2 ## .. .. .. .. ..$ : chr [1:2] "percent" "pce" ## .. .. .. .. ..$ : chr "pce" ## .. .. ..- attr(*, "term.labels")= chr "pce" ## .. .. ..- attr(*, "order")= int 1 ## .. .. ..- attr(*, "intercept")= int 1 ## .. .. ..- attr(*, "response")= int 1 ## .. .. ..- attr(*, ".Environment")=<environment: 0x7f8023a640f0> ## .. .. ..- attr(*, "predvars")= language list(percent, pce) ## .. .. ..- attr(*, "dataClasses")= Named chr [1:2] "numeric" "numeric" ## .. .. .. ..- attr(*, "names")= chr [1:2] "percent" "pce" ## ..$ model :'data.frame': 6 obs. of 2 variables: ## .. ..$ percent: num [1:6] 0.0148 0.0148 0.0149 0.0158 0.0154 ... ## .. ..$ pce : num [1:6] 507 510 516 512 517 ... ## .. ..- attr(*, "terms")=Classes 'terms', 'formula' language percent ~ pce ## .. .. .. ..- attr(*, "variables")= language list(percent, pce) ## .. .. .. ..- attr(*, "factors")= int [1:2, 1] 0 1 ## .. .. .. .. ..- attr(*, "dimnames")=List of 2 ## .. .. .. .. .. ..$ : chr [1:2] "percent" "pce" ## .. .. .. .. .. ..$ : chr "pce" ## .. .. .. ..- attr(*, "term.labels")= chr "pce" ## .. .. .. ..- attr(*, "order")= int 1 ## .. .. .. ..- attr(*, "intercept")= int 1 ## .. .. .. ..- attr(*, "response")= int 1 ## .. .. .. ..- attr(*, ".Environment")=<environment: 0x7f8023a640f0> ## .. .. .. ..- attr(*, "predvars")= language list(percent, pce) ## .. .. .. ..- attr(*, "dataClasses")= Named chr [1:2] "numeric" "numeric" ## .. .. .. .. ..- attr(*, "names")= chr [1:2] "percent" "pce" ## ..- attr(*, "class")= chr "lm" ## $ 1968:List of 12 ## ..$ coefficients : Named num [1:2] 0.027846 -0.000025 ## .. ..- attr(*, "names")= chr [1:2] "(Intercept)" "pce" ## ..$ residuals : Named num [1:12] -0.000186 0.000489 0.000126 -0.000732 -0.000443 ... ## .. ..- attr(*, "names")= chr [1:12] "1" "2" "3" "4" ... ## ..$ effects : Named num [1:12] -0.048297 -0.001335 0.000117 -0.000743 -0.00041 ... ## .. ..- attr(*, "names")= chr [1:12] "(Intercept)" "pce" "" "" ... ## ..$ rank : int 2 ## ..$ fitted.values: Named num [1:12] 0.0146 0.0145 0.0143 0.0143 0.0141 ... ## .. ..- attr(*, "names")= chr [1:12] "1" "2" "3" "4" ... ## ..$ assign : int [1:2] 0 1 ## ..$ qr :List of 5 ## .. ..$ qr : num [1:12, 1:2] -3.464 0.289 0.289 0.289 0.289 ... ## .. .. ..- attr(*, "dimnames")=List of 2 ## .. .. .. ..$ : chr [1:12] "1" "2" "3" "4" ... ## .. .. .. ..$ : chr [1:2] "(Intercept)" "pce" ## .. .. ..- attr(*, "assign")= int [1:2] 0 1 ## .. ..$ qraux: num [1:2] 1.29 1.33 ## .. ..$ pivot: int [1:2] 1 2 ## .. ..$ tol : num 1e-07 ## .. ..$ rank : int 2 ## .. ..- attr(*, "class")= chr "qr" ## ..$ df.residual : int 10 ## ..$ xlevels : Named list() ## ..$ call : language lm(formula = percent ~ pce, data = .x) ## ..$ terms :Classes 'terms', 'formula' language percent ~ pce ## .. .. ..- attr(*, "variables")= language list(percent, pce) ## .. .. ..- attr(*, "factors")= int [1:2, 1] 0 1 ## .. .. .. ..- attr(*, "dimnames")=List of 2 ## .. .. .. .. ..$ : chr [1:2] "percent" "pce" ## .. .. .. .. ..$ : chr "pce" ## .. .. ..- attr(*, "term.labels")= chr "pce" ## .. .. ..- attr(*, "order")= int 1 ## .. .. ..- attr(*, "intercept")= int 1 ## .. .. ..- attr(*, "response")= int 1 ## .. .. ..- attr(*, ".Environment")=<environment: 0x7f80239e2c18> ## .. .. ..- attr(*, "predvars")= language list(percent, pce) ## .. .. ..- attr(*, "dataClasses")= Named chr [1:2] "numeric" "numeric" ## .. .. .. ..- attr(*, "names")= chr [1:2] "percent" "pce" ## ..$ model :'data.frame': 12 obs. of 2 variables: ## .. ..$ percent: num [1:12] 0.0144 0.015 0.0144 0.0135 0.0137 ... ## .. ..$ pce : num [1:12] 531 534 544 544 550 ... ## .. ..- attr(*, "terms")=Classes 'terms', 'formula' language percent ~ pce ## .. .. .. ..- attr(*, "variables")= language list(percent, pce) ## .. .. .. ..- attr(*, "factors")= int [1:2, 1] 0 1 ## .. .. .. .. ..- attr(*, "dimnames")=List of 2 ## .. .. .. .. .. ..$ : chr [1:2] "percent" "pce" ## .. .. .. .. .. ..$ : chr "pce" ## .. .. .. ..- attr(*, "term.labels")= chr "pce" ## .. .. .. ..- attr(*, "order")= int 1 ## .. .. .. ..- attr(*, "intercept")= int 1 ## .. .. .. ..- attr(*, "response")= int 1 ## .. .. .. ..- attr(*, ".Environment")=<environment: 0x7f80239e2c18> ## .. .. .. ..- attr(*, "predvars")= language list(percent, pce) ## .. .. .. ..- attr(*, "dataClasses")= Named chr [1:2] "numeric" "numeric" ## .. .. .. .. ..- attr(*, "names")= chr [1:2] "percent" "pce" ## ..- attr(*, "class")= chr "lm" ## $ 1969:List of 12 ## ..$ coefficients : Named num [1:2] -0.005363 0.000032 ## .. ..- attr(*, "names")= chr [1:2] "(Intercept)" "pce" ## ..$ residuals : Named num [1:12] 1.52e-04 -1.51e-04 -6.82e-05 -9.87e-06 -4.49e-04 ... ## .. ..- attr(*, "names")= chr [1:12] "1" "2" "3" "4" ... ## ..$ effects : Named num [1:12] -4.84e-02 1.42e-03 -6.75e-05 -2.62e-05 -4.87e-04 ... ## .. ..- attr(*, "names")= chr [1:12] "(Intercept)" "pce" "" "" ... ## ..$ rank : int 2 ## ..$ fitted.values: Named num [1:12] 0.0133 0.0135 0.0135 0.0137 0.0139 ... ## .. ..- attr(*, "names")= chr [1:12] "1" "2" "3" "4" ... ## ..$ assign : int [1:2] 0 1 ## ..$ qr :List of 5 ## .. ..$ qr : num [1:12, 1:2] -3.464 0.289 0.289 0.289 0.289 ... ## .. .. ..- attr(*, "dimnames")=List of 2 ## .. .. .. ..$ : chr [1:12] "1" "2" "3" "4" ... ## .. .. .. ..$ : chr [1:2] "(Intercept)" "pce" ## .. .. ..- attr(*, "assign")= int [1:2] 0 1 ## .. ..$ qraux: num [1:2] 1.29 1.24 ## .. ..$ pivot: int [1:2] 1 2 ## .. ..$ tol : num 1e-07 ## .. ..$ rank : int 2 ## .. ..- attr(*, "class")= chr "qr" ## ..$ df.residual : int 10 ## ..$ xlevels : Named list() ## ..$ call : language lm(formula = percent ~ pce, data = .x) ## ..$ terms :Classes 'terms', 'formula' language percent ~ pce ## .. .. ..- attr(*, "variables")= language list(percent, pce) ## .. .. ..- attr(*, "factors")= int [1:2, 1] 0 1 ## .. .. .. ..- attr(*, "dimnames")=List of 2 ## .. .. .. .. ..$ : chr [1:2] "percent" "pce" ## .. .. .. .. ..$ : chr "pce" ## .. .. ..- attr(*, "term.labels")= chr "pce" ## .. .. ..- attr(*, "order")= int 1 ## .. .. ..- attr(*, "intercept")= int 1 ## .. .. ..- attr(*, "response")= int 1 ## .. .. ..- attr(*, ".Environment")=<environment: 0x7f8023967190> ## .. .. ..- attr(*, "predvars")= language list(percent, pce) ## .. .. ..- attr(*, "dataClasses")= Named chr [1:2] "numeric" "numeric" ## .. .. .. ..- attr(*, "names")= chr [1:2] "percent" "pce" ## ..$ model :'data.frame': 12 obs. of 2 variables: ## .. ..$ percent: num [1:12] 0.0135 0.0133 0.0134 0.0136 0.0134 ... ## .. ..$ pce : num [1:12] 584 589 589 594 600 ... ## .. ..- attr(*, "terms")=Classes 'terms', 'formula' language percent ~ pce ## .. .. .. ..- attr(*, "variables")= language list(percent, pce) ## .. .. .. ..- attr(*, "factors")= int [1:2, 1] 0 1 ## .. .. .. .. ..- attr(*, "dimnames")=List of 2 ## .. .. .. .. .. ..$ : chr [1:2] "percent" "pce" ## .. .. .. .. .. ..$ : chr "pce" ## .. .. .. ..- attr(*, "term.labels")= chr "pce" ## .. .. .. ..- attr(*, "order")= int 1 ## .. .. .. ..- attr(*, "intercept")= int 1 ## .. .. .. ..- attr(*, "response")= int 1 ## .. .. .. ..- attr(*, ".Environment")=<environment: 0x7f8023967190> ## .. .. .. ..- attr(*, "predvars")= language list(percent, pce) ## .. .. .. ..- attr(*, "dataClasses")= Named chr [1:2] "numeric" "numeric" ## .. .. .. .. ..- attr(*, "names")= chr [1:2] "percent" "pce" ## ..- attr(*, "class")= chr "lm" ## $ 1970:List of 12 ## ..$ coefficients : Named num [1:2] -0.118058 0.000214 ## .. ..- attr(*, "names")= chr [1:2] "(Intercept)" "pce" ## ..$ residuals : Named num [1:12] -5.71e-04 -4.81e-04 7.62e-04 7.42e-04 -4.76e-05 ... ## .. ..- attr(*, "names")= chr [1:12] "1" "2" "3" "4" ... ## ..$ effects : Named num [1:12] -6.97e-02 8.58e-03 9.65e-04 9.19e-04 8.25e-05 ... ## .. ..- attr(*, "names")= chr [1:12] "(Intercept)" "pce" "" "" ... ## ..$ rank : int 2 ## ..$ fitted.values: Named num [1:12] 0.0163 0.0174 0.017 0.0178 0.0192 ... ## .. ..- attr(*, "names")= chr [1:12] "1" "2" "3" "4" ... ## ..$ assign : int [1:2] 0 1 ## ..$ qr :List of 5 ## .. ..$ qr : num [1:12, 1:2] -3.464 0.289 0.289 0.289 0.289 ... ## .. .. ..- attr(*, "dimnames")=List of 2 ## .. .. .. ..$ : chr [1:12] "1" "2" "3" "4" ... ## .. .. .. ..$ : chr [1:2] "(Intercept)" "pce" ## .. .. ..- attr(*, "assign")= int [1:2] 0 1 ## .. ..$ qraux: num [1:2] 1.29 1.22 ## .. ..$ pivot: int [1:2] 1 2 ## .. ..$ tol : num 1e-07 ## .. ..$ rank : int 2 ## .. ..- attr(*, "class")= chr "qr" ## ..$ df.residual : int 10 ## ..$ xlevels : Named list() ## ..$ call : language lm(formula = percent ~ pce, data = .x) ## ..$ terms :Classes 'terms', 'formula' language percent ~ pce ## .. .. ..- attr(*, "variables")= language list(percent, pce) ## .. .. ..- attr(*, "factors")= int [1:2, 1] 0 1 ## .. .. .. ..- attr(*, "dimnames")=List of 2 ## .. .. .. .. ..$ : chr [1:2] "percent" "pce" ## .. .. .. .. ..$ : chr "pce" ## .. .. ..- attr(*, "term.labels")= chr "pce" ## .. .. ..- attr(*, "order")= int 1 ## .. .. ..- attr(*, "intercept")= int 1 ## .. .. ..- attr(*, "response")= int 1 ## .. .. ..- attr(*, ".Environment")=<environment: 0x7f80244e3270> ## .. .. ..- attr(*, "predvars")= language list(percent, pce) ## .. .. ..- attr(*, "dataClasses")= Named chr [1:2] "numeric" "numeric" ## .. .. .. ..- attr(*, "names")= chr [1:2] "percent" "pce" ## ..$ model :'data.frame': 12 obs. of 2 variables: ## .. ..$ percent: num [1:12] 0.0157 0.0169 0.0178 0.0186 0.0192 ... ## .. ..$ pce : num [1:12] 629 634 632 636 642 ... ## .. ..- attr(*, "terms")=Classes 'terms', 'formula' language percent ~ pce ## .. .. .. ..- attr(*, "variables")= language list(percent, pce) ## .. .. .. ..- attr(*, "factors")= int [1:2, 1] 0 1 ## .. .. .. .. ..- attr(*, "dimnames")=List of 2 ## .. .. .. .. .. ..$ : chr [1:2] "percent" "pce" ## .. .. .. .. .. ..$ : chr "pce" ## .. .. .. ..- attr(*, "term.labels")= chr "pce" ## .. .. .. ..- attr(*, "order")= int 1 ## .. .. .. ..- attr(*, "intercept")= int 1 ## .. .. .. ..- attr(*, "response")= int 1 ## .. .. .. ..- attr(*, ".Environment")=<environment: 0x7f80244e3270> ## .. .. .. ..- attr(*, "predvars")= language list(percent, pce) ## .. .. .. ..- attr(*, "dataClasses")= Named chr [1:2] "numeric" "numeric" ## .. .. .. .. ..- attr(*, "names")= chr [1:2] "percent" "pce" ## ..- attr(*, "class")= chr "lm" ## $ 1971:List of 12 ## ..$ coefficients : Named num [1:2] 1.59e-02 1.18e-05 ## .. ..- attr(*, "names")= chr [1:2] "(Intercept)" "pce" ## ..$ residuals : Named num [1:12] 2.40e-04 -2.24e-04 1.30e-04 -1.10e-04 1.92e-05 ... ## .. ..- attr(*, "names")= chr [1:12] "1" "2" "3" "4" ... ## ..$ effects : Named num [1:12] -8.38e-02 6.67e-04 1.25e-04 -1.41e-04 -2.11e-05 ... ## .. ..- attr(*, "names")= chr [1:12] "(Intercept)" "pce" "" "" ... ## ..$ rank : int 2 ## ..$ fitted.values: Named num [1:12] 0.0239 0.0239 0.024 0.0241 0.0241 ... ## .. ..- attr(*, "names")= chr [1:12] "1" "2" "3" "4" ... ## ..$ assign : int [1:2] 0 1 ## ..$ qr :List of 5 ## .. ..$ qr : num [1:12, 1:2] -3.464 0.289 0.289 0.289 0.289 ... ## .. .. ..- attr(*, "dimnames")=List of 2 ## .. .. .. ..$ : chr [1:12] "1" "2" "3" "4" ... ## .. .. .. ..$ : chr [1:2] "(Intercept)" "pce" ## .. .. ..- attr(*, "assign")= int [1:2] 0 1 ## .. ..$ qraux: num [1:2] 1.29 1.27 ## .. ..$ pivot: int [1:2] 1 2 ## .. ..$ tol : num 1e-07 ## .. ..$ rank : int 2 ## .. ..- attr(*, "class")= chr "qr" ## ..$ df.residual : int 10 ## ..$ xlevels : Named list() ## ..$ call : language lm(formula = percent ~ pce, data = .x) ## ..$ terms :Classes 'terms', 'formula' language percent ~ pce ## .. .. ..- attr(*, "variables")= language list(percent, pce) ## .. .. ..- attr(*, "factors")= int [1:2, 1] 0 1 ## .. .. .. ..- attr(*, "dimnames")=List of 2 ## .. .. .. .. ..$ : chr [1:2] "percent" "pce" ## .. .. .. .. ..$ : chr "pce" ## .. .. ..- attr(*, "term.labels")= chr "pce" ## .. .. ..- attr(*, "order")= int 1 ## .. .. ..- attr(*, "intercept")= int 1 ## .. .. ..- attr(*, "response")= int 1 ## .. .. ..- attr(*, ".Environment")=<environment: 0x7f802414a2e8> ## .. .. ..- attr(*, "predvars")= language list(percent, pce) ## .. .. ..- attr(*, "dataClasses")= Named chr [1:2] "numeric" "numeric" ## .. .. .. ..- attr(*, "names")= chr [1:2] "percent" "pce" ## ..$ model :'data.frame': 12 obs. of 2 variables: ## .. ..$ percent: num [1:12] 0.0241 0.0237 0.0241 0.0239 0.0241 ... ## .. ..$ pce : num [1:12] 676 679 682 689 691 ... ## .. ..- attr(*, "terms")=Classes 'terms', 'formula' language percent ~ pce ## .. .. .. ..- attr(*, "variables")= language list(percent, pce) ## .. .. .. ..- attr(*, "factors")= int [1:2, 1] 0 1 ## .. .. .. .. ..- attr(*, "dimnames")=List of 2 ## .. .. .. .. .. ..$ : chr [1:2] "percent" "pce" ## .. .. .. .. .. ..$ : chr "pce" ## .. .. .. ..- attr(*, "term.labels")= chr "pce" ## .. .. .. ..- attr(*, "order")= int 1 ## .. .. .. ..- attr(*, "intercept")= int 1 ## .. .. .. ..- attr(*, "response")= int 1 ## .. .. .. ..- attr(*, ".Environment")=<environment: 0x7f802414a2e8> ## .. .. .. ..- attr(*, "predvars")= language list(percent, pce) ## .. .. .. ..- attr(*, "dataClasses")= Named chr [1:2] "numeric" "numeric" ## .. .. .. .. ..- attr(*, "names")= chr [1:2] "percent" "pce" ## ..- attr(*, "class")= chr "lm" ## $ 1972:List of 12 ## ..$ coefficients : Named num [1:2] 4.40e-02 -2.71e-05 ## .. ..- attr(*, "names")= chr [1:2] "(Intercept)" "pce" ## ..$ residuals : Named num [1:12] -2.07e-04 -5.31e-04 3.30e-04 2.16e-05 -2.40e-05 ... ## .. ..- attr(*, "names")= chr [1:12] "1" "2" "3" "4" ... ## ..$ effects : Named num [1:12] -8.05e-02 -2.19e-03 4.26e-04 1.02e-04 3.13e-05 ... ## .. ..- attr(*, "names")= chr [1:12] "(Intercept)" "pce" "" "" ... ## ..$ rank : int 2 ## ..$ fitted.values: Named num [1:12] 0.0242 0.0241 0.0238 0.0237 0.0235 ... ## .. ..- attr(*, "names")= chr [1:12] "1" "2" "3" "4" ... ## ..$ assign : int [1:2] 0 1 ## ..$ qr :List of 5 ## .. ..$ qr : num [1:12, 1:2] -3.464 0.289 0.289 0.289 0.289 ... ## .. .. ..- attr(*, "dimnames")=List of 2 ## .. .. .. ..$ : chr [1:12] "1" "2" "3" "4" ... ## .. .. .. ..$ : chr [1:2] "(Intercept)" "pce" ## .. .. ..- attr(*, "assign")= int [1:2] 0 1 ## .. ..$ qraux: num [1:2] 1.29 1.29 ## .. ..$ pivot: int [1:2] 1 2 ## .. ..$ tol : num 1e-07 ## .. ..$ rank : int 2 ## .. ..- attr(*, "class")= chr "qr" ## ..$ df.residual : int 10 ## ..$ xlevels : Named list() ## ..$ call : language lm(formula = percent ~ pce, data = .x) ## ..$ terms :Classes 'terms', 'formula' language percent ~ pce ## .. .. ..- attr(*, "variables")= language list(percent, pce) ## .. .. ..- attr(*, "factors")= int [1:2, 1] 0 1 ## .. .. .. ..- attr(*, "dimnames")=List of 2 ## .. .. .. .. ..$ : chr [1:2] "percent" "pce" ## .. .. .. .. ..$ : chr "pce" ## .. .. ..- attr(*, "term.labels")= chr "pce" ## .. .. ..- attr(*, "order")= int 1 ## .. .. ..- attr(*, "intercept")= int 1 ## .. .. ..- attr(*, "response")= int 1 ## .. .. ..- attr(*, ".Environment")=<environment: 0x7f8061f2f4f0> ## .. .. ..- attr(*, "predvars")= language list(percent, pce) ## .. .. ..- attr(*, "dataClasses")= Named chr [1:2] "numeric" "numeric" ## .. .. .. ..- attr(*, "names")= chr [1:2] "percent" "pce" ## ..$ model :'data.frame': 12 obs. of 2 variables: ## .. ..$ percent: num [1:12] 0.024 0.0236 0.0241 0.0237 0.0235 ... ## .. ..$ pce : num [1:12] 732 736 749 752 758 ... ## .. ..- attr(*, "terms")=Classes 'terms', 'formula' language percent ~ pce ## .. .. .. ..- attr(*, "variables")= language list(percent, pce) ## .. .. .. ..- attr(*, "factors")= int [1:2, 1] 0 1 ## .. .. .. .. ..- attr(*, "dimnames")=List of 2 ## .. .. .. .. .. ..$ : chr [1:2] "percent" "pce" ## .. .. .. .. .. ..$ : chr "pce" ## .. .. .. ..- attr(*, "term.labels")= chr "pce" ## .. .. .. ..- attr(*, "order")= int 1 ## .. .. .. ..- attr(*, "intercept")= int 1 ## .. .. .. ..- attr(*, "response")= int 1 ## .. .. .. ..- attr(*, ".Environment")=<environment: 0x7f8061f2f4f0> ## .. .. .. ..- attr(*, "predvars")= language list(percent, pce) ## .. .. .. ..- attr(*, "dataClasses")= Named chr [1:2] "numeric" "numeric" ## .. .. .. .. ..- attr(*, "names")= chr [1:2] "percent" "pce" ## ..- attr(*, "class")= chr "lm" ## $ 1973:List of 12 ## ..$ coefficients : Named num [1:2] 2.57e-02 -6.05e-06 ## .. ..- attr(*, "names")= chr [1:2] "(Intercept)" "pce" ## ..$ residuals : Named num [1:12] -0.000273 0.000367 0.000121 0.00043 -0.000165 ... ## .. ..- attr(*, "names")= chr [1:12] "1" "2" "3" "4" ... ## ..$ effects : Named num [1:12] -0.071281 -0.000404 0.000134 0.000458 -0.000106 ... ## .. ..- attr(*, "names")= chr [1:12] "(Intercept)" "pce" "" "" ... ## ..$ rank : int 2 ## ..$ fitted.values: Named num [1:12] 0.0208 0.0207 0.0207 0.0207 0.0206 ... ## .. ..- attr(*, "names")= chr [1:12] "1" "2" "3" "4" ... ## ..$ assign : int [1:2] 0 1 ## ..$ qr :List of 5 ## .. ..$ qr : num [1:12, 1:2] -3.464 0.289 0.289 0.289 0.289 ... ## .. .. ..- attr(*, "dimnames")=List of 2 ## .. .. .. ..$ : chr [1:12] "1" "2" "3" "4" ... ## .. .. .. ..$ : chr [1:2] "(Intercept)" "pce" ## .. .. ..- attr(*, "assign")= int [1:2] 0 1 ## .. ..$ qraux: num [1:2] 1.29 1.24 ## .. ..$ pivot: int [1:2] 1 2 ## .. ..$ tol : num 1e-07 ## .. ..$ rank : int 2 ## .. ..- attr(*, "class")= chr "qr" ## ..$ df.residual : int 10 ## ..$ xlevels : Named list() ## ..$ call : language lm(formula = percent ~ pce, data = .x) ## ..$ terms :Classes 'terms', 'formula' language percent ~ pce ## .. .. ..- attr(*, "variables")= language list(percent, pce) ## .. .. ..- attr(*, "factors")= int [1:2, 1] 0 1 ## .. .. .. ..- attr(*, "dimnames")=List of 2 ## .. .. .. .. ..$ : chr [1:2] "percent" "pce" ## .. .. .. .. ..$ : chr "pce" ## .. .. ..- attr(*, "term.labels")= chr "pce" ## .. .. ..- attr(*, "order")= int 1 ## .. .. ..- attr(*, "intercept")= int 1 ## .. .. ..- attr(*, "response")= int 1 ## .. .. ..- attr(*, ".Environment")=<environment: 0x7f80740b3f88> ## .. .. ..- attr(*, "predvars")= language list(percent, pce) ## .. .. ..- attr(*, "dataClasses")= Named chr [1:2] "numeric" "numeric" ## .. .. .. ..- attr(*, "names")= chr [1:2] "percent" "pce" ## ..$ model :'data.frame': 12 obs. of 2 variables: ## .. ..$ percent: num [1:12] 0.0205 0.0211 0.0208 0.0211 0.0205 ... ## .. ..$ pce : num [1:12] 816 826 833 836 842 ... ## .. ..- attr(*, "terms")=Classes 'terms', 'formula' language percent ~ pce ## .. .. .. ..- attr(*, "variables")= language list(percent, pce) ## .. .. .. ..- attr(*, "factors")= int [1:2, 1] 0 1 ## .. .. .. .. ..- attr(*, "dimnames")=List of 2 ## .. .. .. .. .. ..$ : chr [1:2] "percent" "pce" ## .. .. .. .. .. ..$ : chr "pce" ## .. .. .. ..- attr(*, "term.labels")= chr "pce" ## .. .. .. ..- attr(*, "order")= int 1 ## .. .. .. ..- attr(*, "intercept")= int 1 ## .. .. .. ..- attr(*, "response")= int 1 ## .. .. .. ..- attr(*, ".Environment")=<environment: 0x7f80740b3f88> ## .. .. .. ..- attr(*, "predvars")= language list(percent, pce) ## .. .. .. ..- attr(*, "dataClasses")= Named chr [1:2] "numeric" "numeric" ## .. .. .. .. ..- attr(*, "names")= chr [1:2] "percent" "pce" ## ..- attr(*, "class")= chr "lm" ## $ 1974:List of 12 ## ..$ coefficients : Named num [1:2] -5.07e-02 8.05e-05 ## .. ..- attr(*, "names")= chr [1:2] "(Intercept)" "pce" ## ..$ residuals : Named num [1:12] 0.001297 0.001272 -0.000139 -0.000986 -0.001528 ... ## .. ..- attr(*, "names")= chr [1:12] "1" "2" "3" "4" ... ## ..$ effects : Named num [1:12] -0.08379 0.007552 -0.000576 -0.001349 -0.001799 ... ## .. ..- attr(*, "names")= chr [1:12] "(Intercept)" "pce" "" "" ... ## ..$ rank : int 2 ## ..$ fitted.values: Named num [1:12] 0.0205 0.0209 0.0219 0.0226 0.0236 ... ## .. ..- attr(*, "names")= chr [1:12] "1" "2" "3" "4" ... ## ..$ assign : int [1:2] 0 1 ## ..$ qr :List of 5 ## .. ..$ qr : num [1:12, 1:2] -3.464 0.289 0.289 0.289 0.289 ... ## .. .. ..- attr(*, "dimnames")=List of 2 ## .. .. .. ..$ : chr [1:12] "1" "2" "3" "4" ... ## .. .. .. ..$ : chr [1:2] "(Intercept)" "pce" ## .. .. ..- attr(*, "assign")= int [1:2] 0 1 ## .. ..$ qraux: num [1:2] 1.29 1.32 ## .. ..$ pivot: int [1:2] 1 2 ## .. ..$ tol : num 1e-07 ## .. ..$ rank : int 2 ## .. ..- attr(*, "class")= chr "qr" ## ..$ df.residual : int 10 ## ..$ xlevels : Named list() ## ..$ call : language lm(formula = percent ~ pce, data = .x) ## ..$ terms :Classes 'terms', 'formula' language percent ~ pce ## .. .. ..- attr(*, "variables")= language list(percent, pce) ## .. .. ..- attr(*, "factors")= int [1:2, 1] 0 1 ## .. .. .. ..- attr(*, "dimnames")=List of 2 ## .. .. .. .. ..$ : chr [1:2] "percent" "pce" ## .. .. .. .. ..$ : chr "pce" ## .. .. ..- attr(*, "term.labels")= chr "pce" ## .. .. ..- attr(*, "order")= int 1 ## .. .. ..- attr(*, "intercept")= int 1 ## .. .. ..- attr(*, "response")= int 1 ## .. .. ..- attr(*, ".Environment")=<environment: 0x7f80223a3f70> ## .. .. ..- attr(*, "predvars")= language list(percent, pce) ## .. .. ..- attr(*, "dataClasses")= Named chr [1:2] "numeric" "numeric" ## .. .. .. ..- attr(*, "names")= chr [1:2] "percent" "pce" ## ..$ model :'data.frame': 12 obs. of 2 variables: ## .. ..$ percent: num [1:12] 0.0218 0.0222 0.0217 0.0216 0.022 ... ## .. ..$ pce : num [1:12] 884 890 901 911 922 ... ## .. ..- attr(*, "terms")=Classes 'terms', 'formula' language percent ~ pce ## .. .. .. ..- attr(*, "variables")= language list(percent, pce) ## .. .. .. ..- attr(*, "factors")= int [1:2, 1] 0 1 ## .. .. .. .. ..- attr(*, "dimnames")=List of 2 ## .. .. .. .. .. ..$ : chr [1:2] "percent" "pce" ## .. .. .. .. .. ..$ : chr "pce" ## .. .. .. ..- attr(*, "term.labels")= chr "pce" ## .. .. .. ..- attr(*, "order")= int 1 ## .. .. .. ..- attr(*, "intercept")= int 1 ## .. .. .. ..- attr(*, "response")= int 1 ## .. .. .. ..- attr(*, ".Environment")=<environment: 0x7f80223a3f70> ## .. .. .. ..- attr(*, "predvars")= language list(percent, pce) ## .. .. .. ..- attr(*, "dataClasses")= Named chr [1:2] "numeric" "numeric" ## .. .. .. .. ..- attr(*, "names")= chr [1:2] "percent" "pce" ## ..- attr(*, "class")= chr "lm" ## $ 1975:List of 12 ## ..$ coefficients : Named num [1:2] 3.85e-02 -1.64e-06 ## .. ..- attr(*, "names")= chr [1:2] "(Intercept)" "pce" ## ..$ residuals : Named num [1:12] -0.001967 -0.001878 0.000231 0.001289 0.002333 ... ## .. ..- attr(*, "names")= chr [1:12] "1" "2" "3" "4" ... ## ..$ effects : Named num [1:12] -0.127397 -0.000204 0.000931 0.001948 0.002767 ... ## .. ..- attr(*, "names")= chr [1:12] "(Intercept)" "pce" "" "" ... ## ..$ rank : int 2 ## ..$ fitted.values: Named num [1:12] 0.0369 0.0368 0.0368 0.0368 0.0368 ... ## .. ..- attr(*, "names")= chr [1:12] "1" "2" "3" "4" ... ## ..$ assign : int [1:2] 0 1 ## ..$ qr :List of 5 ## .. ..$ qr : num [1:12, 1:2] -3.464 0.289 0.289 0.289 0.289 ... ## .. .. ..- attr(*, "dimnames")=List of 2 ## .. .. .. ..$ : chr [1:12] "1" "2" "3" "4" ... ## .. .. .. ..$ : chr [1:2] "(Intercept)" "pce" ## .. .. ..- attr(*, "assign")= int [1:2] 0 1 ## .. ..$ qraux: num [1:2] 1.29 1.23 ## .. ..$ pivot: int [1:2] 1 2 ## .. ..$ tol : num 1e-07 ## .. ..$ rank : int 2 ## .. ..- attr(*, "class")= chr "qr" ## ..$ df.residual : int 10 ## ..$ xlevels : Named list() ## ..$ call : language lm(formula = percent ~ pce, data = .x) ## ..$ terms :Classes 'terms', 'formula' language percent ~ pce ## .. .. ..- attr(*, "variables")= language list(percent, pce) ## .. .. ..- attr(*, "factors")= int [1:2, 1] 0 1 ## .. .. .. ..- attr(*, "dimnames")=List of 2 ## .. .. .. .. ..$ : chr [1:2] "percent" "pce" ## .. .. .. .. ..$ : chr "pce" ## .. .. ..- attr(*, "term.labels")= chr "pce" ## .. .. ..- attr(*, "order")= int 1 ## .. .. ..- attr(*, "intercept")= int 1 ## .. .. ..- attr(*, "response")= int 1 ## .. .. ..- attr(*, ".Environment")=<environment: 0x7f8007c0fde0> ## .. .. ..- attr(*, "predvars")= language list(percent, pce) ## .. .. ..- attr(*, "dataClasses")= Named chr [1:2] "numeric" "numeric" ## .. .. .. ..- attr(*, "names")= chr [1:2] "percent" "pce" ## ..$ model :'data.frame': 12 obs. of 2 variables: ## .. ..$ percent: num [1:12] 0.0349 0.035 0.0371 0.0381 0.0391 ... ## .. ..$ pce : num [1:12] 976 989 991 995 1019 ... ## .. ..- attr(*, "terms")=Classes 'terms', 'formula' language percent ~ pce ## .. .. .. ..- attr(*, "variables")= language list(percent, pce) ## .. .. .. ..- attr(*, "factors")= int [1:2, 1] 0 1 ## .. .. .. .. ..- attr(*, "dimnames")=List of 2 ## .. .. .. .. .. ..$ : chr [1:2] "percent" "pce" ## .. .. .. .. .. ..$ : chr "pce" ## .. .. .. ..- attr(*, "term.labels")= chr "pce" ## .. .. .. ..- attr(*, "order")= int 1 ## .. .. .. ..- attr(*, "intercept")= int 1 ## .. .. .. ..- attr(*, "response")= int 1 ## .. .. .. ..- attr(*, ".Environment")=<environment: 0x7f8007c0fde0> ## .. .. .. ..- attr(*, "predvars")= language list(percent, pce) ## .. .. .. ..- attr(*, "dataClasses")= Named chr [1:2] "numeric" "numeric" ## .. .. .. .. ..- attr(*, "names")= chr [1:2] "percent" "pce" ## ..- attr(*, "class")= chr "lm" ## $ 1976:List of 12 ## ..$ coefficients : Named num [1:2] 2.31e-02 9.41e-06 ## .. ..- attr(*, "names")= chr [1:2] "(Intercept)" "pce" ## ..$ residuals : Named num [1:12] 1.15e-03 1.62e-04 -3.68e-04 -2.95e-05 -1.30e-03 ... ## .. ..- attr(*, "names")= chr [1:12] "1" "2" "3" "4" ... ## ..$ effects : Named num [1:12] -0.117558 0.00106 -0.00061 -0.000278 -0.001548 ... ## .. ..- attr(*, "names")= chr [1:12] "(Intercept)" "pce" "" "" ... ## ..$ rank : int 2 ## ..$ fitted.values: Named num [1:12] 0.0336 0.0336 0.0336 0.0337 0.0337 ... ## .. ..- attr(*, "names")= chr [1:12] "1" "2" "3" "4" ... ## ..$ assign : int [1:2] 0 1 ## ..$ qr :List of 5 ## .. ..$ qr : num [1:12, 1:2] -3.464 0.289 0.289 0.289 0.289 ... ## .. .. ..- attr(*, "dimnames")=List of 2 ## .. .. .. ..$ : chr [1:12] "1" "2" "3" "4" ... ## .. .. .. ..$ : chr [1:2] "(Intercept)" "pce" ## .. .. ..- attr(*, "assign")= int [1:2] 0 1 ## .. ..$ qraux: num [1:2] 1.29 1.27 ## .. ..$ pivot: int [1:2] 1 2 ## .. ..$ tol : num 1e-07 ## .. ..$ rank : int 2 ## .. ..- attr(*, "class")= chr "qr" ## ..$ df.residual : int 10 ## ..$ xlevels : Named list() ## ..$ call : language lm(formula = percent ~ pce, data = .x) ## ..$ terms :Classes 'terms', 'formula' language percent ~ pce ## .. .. ..- attr(*, "variables")= language list(percent, pce) ## .. .. ..- attr(*, "factors")= int [1:2, 1] 0 1 ## .. .. .. ..- attr(*, "dimnames")=List of 2 ## .. .. .. .. ..$ : chr [1:2] "percent" "pce" ## .. .. .. .. ..$ : chr "pce" ## .. .. ..- attr(*, "term.labels")= chr "pce" ## .. .. ..- attr(*, "order")= int 1 ## .. .. ..- attr(*, "intercept")= int 1 ## .. .. ..- attr(*, "response")= int 1 ## .. .. ..- attr(*, ".Environment")=<environment: 0x7f8007d79f40> ## .. .. ..- attr(*, "predvars")= language list(percent, pce) ## .. .. ..- attr(*, "dataClasses")= Named chr [1:2] "numeric" "numeric" ## .. .. .. ..- attr(*, "names")= chr [1:2] "percent" "pce" ## ..$ model :'data.frame': 12 obs. of 2 variables: ## .. ..$ percent: num [1:12] 0.0347 0.0337 0.0333 0.0337 0.0324 ... ## .. ..$ pce : num [1:12] 1107 1108 1115 1125 1123 ... ## .. ..- attr(*, "terms")=Classes 'terms', 'formula' language percent ~ pce ## .. .. .. ..- attr(*, "variables")= language list(percent, pce) ## .. .. .. ..- attr(*, "factors")= int [1:2, 1] 0 1 ## .. .. .. .. ..- attr(*, "dimnames")=List of 2 ## .. .. .. .. .. ..$ : chr [1:2] "percent" "pce" ## .. .. .. .. .. ..$ : chr "pce" ## .. .. .. ..- attr(*, "term.labels")= chr "pce" ## .. .. .. ..- attr(*, "order")= int 1 ## .. .. .. ..- attr(*, "intercept")= int 1 ## .. .. .. ..- attr(*, "response")= int 1 ## .. .. .. ..- attr(*, ".Environment")=<environment: 0x7f8007d79f40> ## .. .. .. ..- attr(*, "predvars")= language list(percent, pce) ## .. .. .. ..- attr(*, "dataClasses")= Named chr [1:2] "numeric" "numeric" ## .. .. .. .. ..- attr(*, "names")= chr [1:2] "percent" "pce" ## ..- attr(*, "class")= chr "lm" ## $ 1977:List of 12 ## ..$ coefficients : Named num [1:2] 7.45e-02 -3.37e-05 ## .. ..- attr(*, "names")= chr [1:2] "(Intercept)" "pce" ## ..$ residuals : Named num [1:12] -0.000415 0.000852 0.000444 -0.000409 -0.000778 ... ## .. ..- attr(*, "names")= chr [1:12] "1" "2" "3" "4" ... ## ..$ effects : Named num [1:12] -0.109618 -0.004303 0.000402 -0.000398 -0.000707 ... ## .. ..- attr(*, "names")= chr [1:12] "(Intercept)" "pce" "" "" ... ## ..$ rank : int 2 ## ..$ fitted.values: Named num [1:12] 0.0336 0.0331 0.0328 0.0325 0.0322 ... ## .. ..- attr(*, "names")= chr [1:12] "1" "2" "3" "4" ... ## ..$ assign : int [1:2] 0 1 ## ..$ qr :List of 5 ## .. ..$ qr : num [1:12, 1:2] -3.464 0.289 0.289 0.289 0.289 ... ## .. .. ..- attr(*, "dimnames")=List of 2 ## .. .. .. ..$ : chr [1:12] "1" "2" "3" "4" ... ## .. .. .. ..$ : chr [1:2] "(Intercept)" "pce" ## .. .. ..- attr(*, "assign")= int [1:2] 0 1 ## .. ..$ qraux: num [1:2] 1.29 1.23 ## .. ..$ pivot: int [1:2] 1 2 ## .. ..$ tol : num 1e-07 ## .. ..$ rank : int 2 ## .. ..- attr(*, "class")= chr "qr" ## ..$ df.residual : int 10 ## ..$ xlevels : Named list() ## ..$ call : language lm(formula = percent ~ pce, data = .x) ## ..$ terms :Classes 'terms', 'formula' language percent ~ pce ## .. .. ..- attr(*, "variables")= language list(percent, pce) ## .. .. ..- attr(*, "factors")= int [1:2, 1] 0 1 ## .. .. .. ..- attr(*, "dimnames")=List of 2 ## .. .. .. .. ..$ : chr [1:2] "percent" "pce" ## .. .. .. .. ..$ : chr "pce" ## .. .. ..- attr(*, "term.labels")= chr "pce" ## .. .. ..- attr(*, "order")= int 1 ## .. .. ..- attr(*, "intercept")= int 1 ## .. .. ..- attr(*, "response")= int 1 ## .. .. ..- attr(*, ".Environment")=<environment: 0x7f8007e19450> ## .. .. ..- attr(*, "predvars")= language list(percent, pce) ## .. .. ..- attr(*, "dataClasses")= Named chr [1:2] "numeric" "numeric" ## .. .. .. ..- attr(*, "names")= chr [1:2] "percent" "pce" ## ..$ model :'data.frame': 12 obs. of 2 variables: ## .. ..$ percent: num [1:12] 0.0332 0.0339 0.0333 0.0321 0.0314 ... ## .. ..$ pce : num [1:12] 1215 1231 1238 1247 1257 ... ## .. ..- attr(*, "terms")=Classes 'terms', 'formula' language percent ~ pce ## .. .. .. ..- attr(*, "variables")= language list(percent, pce) ## .. .. .. ..- attr(*, "factors")= int [1:2, 1] 0 1 ## .. .. .. .. ..- attr(*, "dimnames")=List of 2 ## .. .. .. .. .. ..$ : chr [1:2] "percent" "pce" ## .. .. .. .. .. ..$ : chr "pce" ## .. .. .. ..- attr(*, "term.labels")= chr "pce" ## .. .. .. ..- attr(*, "order")= int 1 ## .. .. .. ..- attr(*, "intercept")= int 1 ## .. .. .. ..- attr(*, "response")= int 1 ## .. .. .. ..- attr(*, ".Environment")=<environment: 0x7f8007e19450> ## .. .. .. ..- attr(*, "predvars")= language list(percent, pce) ## .. .. .. ..- attr(*, "dataClasses")= Named chr [1:2] "numeric" "numeric" ## .. .. .. .. ..- attr(*, "names")= chr [1:2] "percent" "pce" ## ..- attr(*, "class")= chr "lm" ## $ 1978:List of 12 ## ..$ coefficients : Named num [1:2] 4.42e-02 -1.15e-05 ## .. ..- attr(*, "names")= chr [1:2] "(Intercept)" "pce" ## ..$ residuals : Named num [1:12] 4.25e-04 -7.19e-05 2.51e-04 -2.64e-04 -3.46e-04 ... ## .. ..- attr(*, "names")= chr [1:12] "1" "2" "3" "4" ... ## ..$ effects : Named num [1:12] -0.096321 -0.00194 0.000174 -0.000356 -0.00045 ... ## .. ..- attr(*, "names")= chr [1:12] "(Intercept)" "pce" "" "" ... ## ..$ rank : int 2 ## ..$ fitted.values: Named num [1:12] 0.0289 0.0286 0.0283 0.0281 0.0279 ... ## .. ..- attr(*, "names")= chr [1:12] "1" "2" "3" "4" ... ## ..$ assign : int [1:2] 0 1 ## ..$ qr :List of 5 ## .. ..$ qr : num [1:12, 1:2] -3.464 0.289 0.289 0.289 0.289 ... ## .. .. ..- attr(*, "dimnames")=List of 2 ## .. .. .. ..$ : chr [1:12] "1" "2" "3" "4" ... ## .. .. .. ..$ : chr [1:2] "(Intercept)" "pce" ## .. .. ..- attr(*, "assign")= int [1:2] 0 1 ## .. ..$ qraux: num [1:2] 1.29 1.28 ## .. ..$ pivot: int [1:2] 1 2 ## .. ..$ tol : num 1e-07 ## .. ..$ rank : int 2 ## .. ..- attr(*, "class")= chr "qr" ## ..$ df.residual : int 10 ## ..$ xlevels : Named list() ## ..$ call : language lm(formula = percent ~ pce, data = .x) ## ..$ terms :Classes 'terms', 'formula' language percent ~ pce ## .. .. ..- attr(*, "variables")= language list(percent, pce) ## .. .. ..- attr(*, "factors")= int [1:2, 1] 0 1 ## .. .. .. ..- attr(*, "dimnames")=List of 2 ## .. .. .. .. ..$ : chr [1:2] "percent" "pce" ## .. .. .. .. ..$ : chr "pce" ## .. .. ..- attr(*, "term.labels")= chr "pce" ## .. .. ..- attr(*, "order")= int 1 ## .. .. ..- attr(*, "intercept")= int 1 ## .. .. ..- attr(*, "response")= int 1 ## .. .. ..- attr(*, ".Environment")=<environment: 0x7f8007f207a0> ## .. .. ..- attr(*, "predvars")= language list(percent, pce) ## .. .. ..- attr(*, "dataClasses")= Named chr [1:2] "numeric" "numeric" ## .. .. .. ..- attr(*, "names")= chr [1:2] "percent" "pce" ## ..$ model :'data.frame': 12 obs. of 2 variables: ## .. ..$ percent: num [1:12] 0.0293 0.0285 0.0286 0.0278 0.0276 ... ## .. ..$ pce : num [1:12] 1330 1355 1378 1396 1412 ... ## .. ..- attr(*, "terms")=Classes 'terms', 'formula' language percent ~ pce ## .. .. .. ..- attr(*, "variables")= language list(percent, pce) ## .. .. .. ..- attr(*, "factors")= int [1:2, 1] 0 1 ## .. .. .. .. ..- attr(*, "dimnames")=List of 2 ## .. .. .. .. .. ..$ : chr [1:2] "percent" "pce" ## .. .. .. .. .. ..$ : chr "pce" ## .. .. .. ..- attr(*, "term.labels")= chr "pce" ## .. .. .. ..- attr(*, "order")= int 1 ## .. .. .. ..- attr(*, "intercept")= int 1 ## .. .. .. ..- attr(*, "response")= int 1 ## .. .. .. ..- attr(*, ".Environment")=<environment: 0x7f8007f207a0> ## .. .. .. ..- attr(*, "predvars")= language list(percent, pce) ## .. .. .. ..- attr(*, "dataClasses")= Named chr [1:2] "numeric" "numeric" ## .. .. .. .. ..- attr(*, "names")= chr [1:2] "percent" "pce" ## ..- attr(*, "class")= chr "lm" ## $ 1979:List of 12 ## ..$ coefficients : Named num [1:2] 1.93e-02 5.01e-06 ## .. ..- attr(*, "names")= chr [1:2] "(Intercept)" "pce" ## ..$ residuals : Named num [1:12] 4.38e-04 6.24e-04 2.49e-04 9.64e-06 -1.14e-03 ... ## .. ..- attr(*, "names")= chr [1:12] "1" "2" "3" "4" ... ## ..$ effects : Named num [1:12] -9.45e-02 9.45e-04 7.17e-05 -1.51e-04 -1.25e-03 ... ## .. ..- attr(*, "names")= chr [1:12] "(Intercept)" "pce" "" "" ... ## ..$ rank : int 2 ## ..$ fitted.values: Named num [1:12] 0.0269 0.0269 0.027 0.027 0.0271 ... ## .. ..- attr(*, "names")= chr [1:12] "1" "2" "3" "4" ... ## ..$ assign : int [1:2] 0 1 ## ..$ qr :List of 5 ## .. ..$ qr : num [1:12, 1:2] -3.464 0.289 0.289 0.289 0.289 ... ## .. .. ..- attr(*, "dimnames")=List of 2 ## .. .. .. ..$ : chr [1:12] "1" "2" "3" "4" ... ## .. .. .. ..$ : chr [1:2] "(Intercept)" "pce" ## .. .. ..- attr(*, "assign")= int [1:2] 0 1 ## .. ..$ qraux: num [1:2] 1.29 1.26 ## .. ..$ pivot: int [1:2] 1 2 ## .. ..$ tol : num 1e-07 ## .. ..$ rank : int 2 ## .. ..- attr(*, "class")= chr "qr" ## ..$ df.residual : int 10 ## ..$ xlevels : Named list() ## ..$ call : language lm(formula = percent ~ pce, data = .x) ## ..$ terms :Classes 'terms', 'formula' language percent ~ pce ## .. .. ..- attr(*, "variables")= language list(percent, pce) ## .. .. ..- attr(*, "factors")= int [1:2, 1] 0 1 ## .. .. .. ..- attr(*, "dimnames")=List of 2 ## .. .. .. .. ..$ : chr [1:2] "percent" "pce" ## .. .. .. .. ..$ : chr "pce" ## .. .. ..- attr(*, "term.labels")= chr "pce" ## .. .. ..- attr(*, "order")= int 1 ## .. .. ..- attr(*, "intercept")= int 1 ## .. .. ..- attr(*, "response")= int 1 ## .. .. ..- attr(*, ".Environment")=<environment: 0x7f8012051c48> ## .. .. ..- attr(*, "predvars")= language list(percent, pce) ## .. .. ..- attr(*, "dataClasses")= Named chr [1:2] "numeric" "numeric" ## .. .. .. ..- attr(*, "names")= chr [1:2] "percent" "pce" ## ..$ model :'data.frame': 12 obs. of 2 variables: ## .. ..$ percent: num [1:12] 0.0273 0.0276 0.0272 0.027 0.026 ... ## .. ..$ pce : num [1:12] 1502 1518 1531 1538 1559 ... ## .. ..- attr(*, "terms")=Classes 'terms', 'formula' language percent ~ pce ## .. .. .. ..- attr(*, "variables")= language list(percent, pce) ## .. .. .. ..- attr(*, "factors")= int [1:2, 1] 0 1 ## .. .. .. .. ..- attr(*, "dimnames")=List of 2 ## .. .. .. .. .. ..$ : chr [1:2] "percent" "pce" ## .. .. .. .. .. ..$ : chr "pce" ## .. .. .. ..- attr(*, "term.labels")= chr "pce" ## .. .. .. ..- attr(*, "order")= int 1 ## .. .. .. ..- attr(*, "intercept")= int 1 ## .. .. .. ..- attr(*, "response")= int 1 ## .. .. .. ..- attr(*, ".Environment")=<environment: 0x7f8012051c48> ## .. .. .. ..- attr(*, "predvars")= language list(percent, pce) ## .. .. .. ..- attr(*, "dataClasses")= Named chr [1:2] "numeric" "numeric" ## .. .. .. .. ..- attr(*, "names")= chr [1:2] "percent" "pce" ## ..- attr(*, "class")= chr "lm" ## $ 1980:List of 12 ## ..$ coefficients : Named num [1:2] -7.45e-03 2.35e-05 ## .. ..- attr(*, "names")= chr [1:2] "(Intercept)" "pce" ## ..$ residuals : Named num [1:12] -2.93e-03 -2.97e-03 -3.03e-03 1.61e-05 2.63e-03 ... ## .. ..- attr(*, "names")= chr [1:12] "1" "2" "3" "4" ... ## ..$ effects : Named num [1:12] -0.11672 0.00441 -0.00206 0.00112 0.00368 ... ## .. ..- attr(*, "names")= chr [1:12] "(Intercept)" "pce" "" "" ... ## ..$ rank : int 2 ## ..$ fitted.values: Named num [1:12] 0.0324 0.0325 0.0327 0.0324 0.0325 ... ## .. ..- attr(*, "names")= chr [1:12] "1" "2" "3" "4" ... ## ..$ assign : int [1:2] 0 1 ## ..$ qr :List of 5 ## .. ..$ qr : num [1:12, 1:2] -3.464 0.289 0.289 0.289 0.289 ... ## .. .. ..- attr(*, "dimnames")=List of 2 ## .. .. .. ..$ : chr [1:12] "1" "2" "3" "4" ... ## .. .. .. ..$ : chr [1:2] "(Intercept)" "pce" ## .. .. ..- attr(*, "assign")= int [1:2] 0 1 ## .. ..$ qraux: num [1:2] 1.29 1.2 ## .. ..$ pivot: int [1:2] 1 2 ## .. ..$ tol : num 1e-07 ## .. ..$ rank : int 2 ## .. ..- attr(*, "class")= chr "qr" ## ..$ df.residual : int 10 ## ..$ xlevels : Named list() ## ..$ call : language lm(formula = percent ~ pce, data = .x) ## ..$ terms :Classes 'terms', 'formula' language percent ~ pce ## .. .. ..- attr(*, "variables")= language list(percent, pce) ## .. .. ..- attr(*, "factors")= int [1:2, 1] 0 1 ## .. .. .. ..- attr(*, "dimnames")=List of 2 ## .. .. .. .. ..$ : chr [1:2] "percent" "pce" ## .. .. .. .. ..$ : chr "pce" ## .. .. ..- attr(*, "term.labels")= chr "pce" ## .. .. ..- attr(*, "order")= int 1 ## .. .. ..- attr(*, "intercept")= int 1 ## .. .. ..- attr(*, "response")= int 1 ## .. .. ..- attr(*, ".Environment")=<environment: 0x7f80121bb0e8> ## .. .. ..- attr(*, "predvars")= language list(percent, pce) ## .. .. ..- attr(*, "dataClasses")= Named chr [1:2] "numeric" "numeric" ## .. .. .. ..- attr(*, "names")= chr [1:2] "percent" "pce" ## ..$ model :'data.frame': 12 obs. of 2 variables: ## .. ..$ percent: num [1:12] 0.0295 0.0296 0.0297 0.0324 0.0351 ... ## .. ..$ pce : num [1:12] 1697 1701 1708 1695 1700 ... ## .. ..- attr(*, "terms")=Classes 'terms', 'formula' language percent ~ pce ## .. .. .. ..- attr(*, "variables")= language list(percent, pce) ## .. .. .. ..- attr(*, "factors")= int [1:2, 1] 0 1 ## .. .. .. .. ..- attr(*, "dimnames")=List of 2 ## .. .. .. .. .. ..$ : chr [1:2] "percent" "pce" ## .. .. .. .. .. ..$ : chr "pce" ## .. .. .. ..- attr(*, "term.labels")= chr "pce" ## .. .. .. ..- attr(*, "order")= int 1 ## .. .. .. ..- attr(*, "intercept")= int 1 ## .. .. .. ..- attr(*, "response")= int 1 ## .. .. .. ..- attr(*, ".Environment")=<environment: 0x7f80121bb0e8> ## .. .. .. ..- attr(*, "predvars")= language list(percent, pce) ## .. .. .. ..- attr(*, "dataClasses")= Named chr [1:2] "numeric" "numeric" ## .. .. .. .. ..- attr(*, "names")= chr [1:2] "percent" "pce" ## ..- attr(*, "class")= chr "lm" ## $ 1981:List of 12 ## ..$ coefficients : Named num [1:2] -2.49e-02 3.15e-05 ## .. ..- attr(*, "names")= chr [1:2] "(Intercept)" "pce" ## ..$ residuals : Named num [1:12] 0.001276 0.00072 -0.000193 -0.00076 0.000246 ... ## .. ..- attr(*, "names")= chr [1:12] "1" "2" "3" "4" ... ## ..$ effects : Named num [1:12] -0.124684 0.004009 -0.000524 -0.001087 -0.000055 ... ## .. ..- attr(*, "names")= chr [1:12] "(Intercept)" "pce" "" "" ... ## ..$ rank : int 2 ## ..$ fitted.values: Named num [1:12] 0.034 0.0344 0.035 0.0351 0.0354 ... ## .. ..- attr(*, "names")= chr [1:12] "1" "2" "3" "4" ... ## ..$ assign : int [1:2] 0 1 ## ..$ qr :List of 5 ## .. ..$ qr : num [1:12, 1:2] -3.464 0.289 0.289 0.289 0.289 ... ## .. .. ..- attr(*, "dimnames")=List of 2 ## .. .. .. ..$ : chr [1:12] "1" "2" "3" "4" ... ## .. .. .. ..$ : chr [1:2] "(Intercept)" "pce" ## .. .. ..- attr(*, "assign")= int [1:2] 0 1 ## .. ..$ qraux: num [1:2] 1.29 1.28 ## .. ..$ pivot: int [1:2] 1 2 ## .. ..$ tol : num 1e-07 ## .. ..$ rank : int 2 ## .. ..- attr(*, "class")= chr "qr" ## ..$ df.residual : int 10 ## ..$ xlevels : Named list() ## ..$ call : language lm(formula = percent ~ pce, data = .x) ## ..$ terms :Classes 'terms', 'formula' language percent ~ pce ## .. .. ..- attr(*, "variables")= language list(percent, pce) ## .. .. ..- attr(*, "factors")= int [1:2, 1] 0 1 ## .. .. .. ..- attr(*, "dimnames")=List of 2 ## .. .. .. .. ..$ : chr [1:2] "percent" "pce" ## .. .. .. .. ..$ : chr "pce" ## .. .. ..- attr(*, "term.labels")= chr "pce" ## .. .. ..- attr(*, "order")= int 1 ## .. .. ..- attr(*, "intercept")= int 1 ## .. .. ..- attr(*, "response")= int 1 ## .. .. ..- attr(*, ".Environment")=<environment: 0x7f80122b4f60> ## .. .. ..- attr(*, "predvars")= language list(percent, pce) ## .. .. ..- attr(*, "dataClasses")= Named chr [1:2] "numeric" "numeric" ## .. .. .. ..- attr(*, "names")= chr [1:2] "percent" "pce" ## ..$ model :'data.frame': 12 obs. of 2 variables: ## .. ..$ percent: num [1:12] 0.0353 0.0351 0.0348 0.0343 0.0356 ... ## .. ..$ pce : num [1:12] 1870 1884 1903 1904 1914 ... ## .. ..- attr(*, "terms")=Classes 'terms', 'formula' language percent ~ pce ## .. .. .. ..- attr(*, "variables")= language list(percent, pce) ## .. .. .. ..- attr(*, "factors")= int [1:2, 1] 0 1 ## .. .. .. .. ..- attr(*, "dimnames")=List of 2 ## .. .. .. .. .. ..$ : chr [1:2] "percent" "pce" ## .. .. .. .. .. ..$ : chr "pce" ## .. .. .. ..- attr(*, "term.labels")= chr "pce" ## .. .. .. ..- attr(*, "order")= int 1 ## .. .. .. ..- attr(*, "intercept")= int 1 ## .. .. .. ..- attr(*, "response")= int 1 ## .. .. .. ..- attr(*, ".Environment")=<environment: 0x7f80122b4f60> ## .. .. .. ..- attr(*, "predvars")= language list(percent, pce) ## .. .. .. ..- attr(*, "dataClasses")= Named chr [1:2] "numeric" "numeric" ## .. .. .. .. ..- attr(*, "names")= chr [1:2] "percent" "pce" ## ..- attr(*, "class")= chr "lm" ## $ 1982:List of 12 ## ..$ coefficients : Named num [1:2] -8.88e-02 6.52e-05 ## .. ..- attr(*, "names")= chr [1:2] "(Intercept)" "pce" ## ..$ residuals : Named num [1:12] -0.000667 -0.000933 -0.00033 0.001001 0.000176 ... ## .. ..- attr(*, "names")= chr [1:12] "1" "2" "3" "4" ... ## ..$ effects : Named num [1:12] -1.60e-01 1.16e-02 -6.76e-05 1.26e-03 3.63e-04 ... ## .. ..- attr(*, "names")= chr [1:12] "(Intercept)" "pce" "" "" ... ## ..$ rank : int 2 ## ..$ fitted.values: Named num [1:12] 0.0413 0.0429 0.0431 0.0432 0.0444 ... ## .. ..- attr(*, "names")= chr [1:12] "1" "2" "3" "4" ... ## ..$ assign : int [1:2] 0 1 ## ..$ qr :List of 5 ## .. ..$ qr : num [1:12, 1:2] -3.464 0.289 0.289 0.289 0.289 ... ## .. .. ..- attr(*, "dimnames")=List of 2 ## .. .. .. ..$ : chr [1:12] "1" "2" "3" "4" ... ## .. .. .. ..$ : chr [1:2] "(Intercept)" "pce" ## .. .. ..- attr(*, "assign")= int [1:2] 0 1 ## .. ..$ qraux: num [1:2] 1.29 1.19 ## .. ..$ pivot: int [1:2] 1 2 ## .. ..$ tol : num 1e-07 ## .. ..$ rank : int 2 ## .. ..- attr(*, "class")= chr "qr" ## ..$ df.residual : int 10 ## ..$ xlevels : Named list() ## ..$ call : language lm(formula = percent ~ pce, data = .x) ## ..$ terms :Classes 'terms', 'formula' language percent ~ pce ## .. .. ..- attr(*, "variables")= language list(percent, pce) ## .. .. ..- attr(*, "factors")= int [1:2, 1] 0 1 ## .. .. .. ..- attr(*, "dimnames")=List of 2 ## .. .. .. .. ..$ : chr [1:2] "percent" "pce" ## .. .. .. .. ..$ : chr "pce" ## .. .. ..- attr(*, "term.labels")= chr "pce" ## .. .. ..- attr(*, "order")= int 1 ## .. .. ..- attr(*, "intercept")= int 1 ## .. .. ..- attr(*, "response")= int 1 ## .. .. ..- attr(*, ".Environment")=<environment: 0x7f801248b1c8> ## .. .. ..- attr(*, "predvars")= language list(percent, pce) ## .. .. ..- attr(*, "dataClasses")= Named chr [1:2] "numeric" "numeric" ## .. .. .. ..- attr(*, "names")= chr [1:2] "percent" "pce" ## ..$ model :'data.frame': 12 obs. of 2 variables: ## .. ..$ percent: num [1:12] 0.0407 0.042 0.0427 0.0442 0.0446 ... ## .. ..$ pce : num [1:12] 1997 2021 2024 2026 2044 ... ## .. ..- attr(*, "terms")=Classes 'terms', 'formula' language percent ~ pce ## .. .. .. ..- attr(*, "variables")= language list(percent, pce) ## .. .. .. ..- attr(*, "factors")= int [1:2, 1] 0 1 ## .. .. .. .. ..- attr(*, "dimnames")=List of 2 ## .. .. .. .. .. ..$ : chr [1:2] "percent" "pce" ## .. .. .. .. .. ..$ : chr "pce" ## .. .. .. ..- attr(*, "term.labels")= chr "pce" ## .. .. .. ..- attr(*, "order")= int 1 ## .. .. .. ..- attr(*, "intercept")= int 1 ## .. .. .. ..- attr(*, "response")= int 1 ## .. .. .. ..- attr(*, ".Environment")=<environment: 0x7f801248b1c8> ## .. .. .. ..- attr(*, "predvars")= language list(percent, pce) ## .. .. .. ..- attr(*, "dataClasses")= Named chr [1:2] "numeric" "numeric" ## .. .. .. .. ..- attr(*, "names")= chr [1:2] "percent" "pce" ## ..- attr(*, "class")= chr "lm" ## $ 1983:List of 12 ## ..$ coefficients : Named num [1:2] 0.146101 -0.000044 ## .. ..- attr(*, "names")= chr [1:2] "(Intercept)" "pce" ## ..$ residuals : Named num [1:12] -0.000964 -0.000816 -0.000297 0.000108 0.00045 ... ## .. ..- attr(*, "names")= chr [1:12] "1" "2" "3" "4" ... ## ..$ effects : Named num [1:12] -0.158172 -0.011088 0.000018 0.00038 0.000687 ... ## .. ..- attr(*, "names")= chr [1:12] "(Intercept)" "pce" "" "" ... ## ..$ rank : int 2 ## ..$ fitted.values: Named num [1:12] 0.0504 0.0503 0.0491 0.0481 0.0472 ... ## .. ..- attr(*, "names")= chr [1:12] "1" "2" "3" "4" ... ## ..$ assign : int [1:2] 0 1 ## ..$ qr :List of 5 ## .. ..$ qr : num [1:12, 1:2] -3.464 0.289 0.289 0.289 0.289 ... ## .. .. ..- attr(*, "dimnames")=List of 2 ## .. .. .. ..$ : chr [1:12] "1" "2" "3" "4" ... ## .. .. .. ..$ : chr [1:2] "(Intercept)" "pce" ## .. .. ..- attr(*, "assign")= int [1:2] 0 1 ## .. ..$ qraux: num [1:2] 1.29 1.32 ## .. ..$ pivot: int [1:2] 1 2 ## .. ..$ tol : num 1e-07 ## .. ..$ rank : int 2 ## .. ..- attr(*, "class")= chr "qr" ## ..$ df.residual : int 10 ## ..$ xlevels : Named list() ## ..$ call : language lm(formula = percent ~ pce, data = .x) ## ..$ terms :Classes 'terms', 'formula' language percent ~ pce ## .. .. ..- attr(*, "variables")= language list(percent, pce) ## .. .. ..- attr(*, "factors")= int [1:2, 1] 0 1 ## .. .. .. ..- attr(*, "dimnames")=List of 2 ## .. .. .. .. ..$ : chr [1:2] "percent" "pce" ## .. .. .. .. ..$ : chr "pce" ## .. .. ..- attr(*, "term.labels")= chr "pce" ## .. .. ..- attr(*, "order")= int 1 ## .. .. ..- attr(*, "intercept")= int 1 ## .. .. ..- attr(*, "response")= int 1 ## .. .. ..- attr(*, ".Environment")=<environment: 0x7f8010cad060> ## .. .. ..- attr(*, "predvars")= language list(percent, pce) ## .. .. ..- attr(*, "dataClasses")= Named chr [1:2] "numeric" "numeric" ## .. .. .. ..- attr(*, "names")= chr [1:2] "percent" "pce" ## ..$ model :'data.frame': 12 obs. of 2 variables: ## .. ..$ percent: num [1:12] 0.0494 0.0494 0.0488 0.0482 0.0477 ... ## .. ..$ pce : num [1:12] 2174 2177 2203 2226 2246 ... ## .. ..- attr(*, "terms")=Classes 'terms', 'formula' language percent ~ pce ## .. .. .. ..- attr(*, "variables")= language list(percent, pce) ## .. .. .. ..- attr(*, "factors")= int [1:2, 1] 0 1 ## .. .. .. .. ..- attr(*, "dimnames")=List of 2 ## .. .. .. .. .. ..$ : chr [1:2] "percent" "pce" ## .. .. .. .. .. ..$ : chr "pce" ## .. .. .. ..- attr(*, "term.labels")= chr "pce" ## .. .. .. ..- attr(*, "order")= int 1 ## .. .. .. ..- attr(*, "intercept")= int 1 ## .. .. .. ..- attr(*, "response")= int 1 ## .. .. .. ..- attr(*, ".Environment")=<environment: 0x7f8010cad060> ## .. .. .. ..- attr(*, "predvars")= language list(percent, pce) ## .. .. .. ..- attr(*, "dataClasses")= Named chr [1:2] "numeric" "numeric" ## .. .. .. .. ..- attr(*, "names")= chr [1:2] "percent" "pce" ## ..- attr(*, "class")= chr "lm" ## $ 1984:List of 12 ## ..$ coefficients : Named num [1:2] 7.89e-02 -1.72e-05 ## .. ..- attr(*, "names")= chr [1:2] "(Intercept)" "pce" ## ..$ residuals : Named num [1:12] 9.20e-04 -2.97e-04 -2.89e-05 4.58e-04 -5.71e-04 ... ## .. ..- attr(*, "names")= chr [1:12] "1" "2" "3" "4" ... ## ..$ effects : Named num [1:12] -0.125039 -0.003282 -0.00015 0.000287 -0.000774 ... ## .. ..- attr(*, "names")= chr [1:12] "(Intercept)" "pce" "" "" ... ## ..$ rank : int 2 ## ..$ fitted.values: Named num [1:12] 0.0373 0.0376 0.0371 0.0367 0.0364 ... ## .. ..- attr(*, "names")= chr [1:12] "1" "2" "3" "4" ... ## ..$ assign : int [1:2] 0 1 ## ..$ qr :List of 5 ## .. ..$ qr : num [1:12, 1:2] -3.464 0.289 0.289 0.289 0.289 ... ## .. .. ..- attr(*, "dimnames")=List of 2 ## .. .. .. ..$ : chr [1:12] "1" "2" "3" "4" ... ## .. .. .. ..$ : chr [1:2] "(Intercept)" "pce" ## .. .. ..- attr(*, "assign")= int [1:2] 0 1 ## .. ..$ qraux: num [1:2] 1.29 1.38 ## .. ..$ pivot: int [1:2] 1 2 ## .. ..$ tol : num 1e-07 ## .. ..$ rank : int 2 ## .. ..- attr(*, "class")= chr "qr" ## ..$ df.residual : int 10 ## ..$ xlevels : Named list() ## ..$ call : language lm(formula = percent ~ pce, data = .x) ## ..$ terms :Classes 'terms', 'formula' language percent ~ pce ## .. .. ..- attr(*, "variables")= language list(percent, pce) ## .. .. ..- attr(*, "factors")= int [1:2, 1] 0 1 ## .. .. .. ..- attr(*, "dimnames")=List of 2 ## .. .. .. .. ..$ : chr [1:2] "percent" "pce" ## .. .. .. .. ..$ : chr "pce" ## .. .. ..- attr(*, "term.labels")= chr "pce" ## .. .. ..- attr(*, "order")= int 1 ## .. .. ..- attr(*, "intercept")= int 1 ## .. .. ..- attr(*, "response")= int 1 ## .. .. ..- attr(*, ".Environment")=<environment: 0x7f8010d6e480> ## .. .. ..- attr(*, "predvars")= language list(percent, pce) ## .. .. ..- attr(*, "dataClasses")= Named chr [1:2] "numeric" "numeric" ## .. .. .. ..- attr(*, "names")= chr [1:2] "percent" "pce" ## ..$ model :'data.frame': 12 obs. of 2 variables: ## .. ..$ percent: num [1:12] 0.0383 0.0373 0.0371 0.0372 0.0358 ... ## .. ..$ pce : num [1:12] 2419 2404 2432 2458 2474 ... ## .. ..- attr(*, "terms")=Classes 'terms', 'formula' language percent ~ pce ## .. .. .. ..- attr(*, "variables")= language list(percent, pce) ## .. .. .. ..- attr(*, "factors")= int [1:2, 1] 0 1 ## .. .. .. .. ..- attr(*, "dimnames")=List of 2 ## .. .. .. .. .. ..$ : chr [1:2] "percent" "pce" ## .. .. .. .. .. ..$ : chr "pce" ## .. .. .. ..- attr(*, "term.labels")= chr "pce" ## .. .. .. ..- attr(*, "order")= int 1 ## .. .. .. ..- attr(*, "intercept")= int 1 ## .. .. .. ..- attr(*, "response")= int 1 ## .. .. .. ..- attr(*, ".Environment")=<environment: 0x7f8010d6e480> ## .. .. .. ..- attr(*, "predvars")= language list(percent, pce) ## .. .. .. ..- attr(*, "dataClasses")= Named chr [1:2] "numeric" "numeric" ## .. .. .. .. ..- attr(*, "names")= chr [1:2] "percent" "pce" ## ..- attr(*, "class")= chr "lm" ## $ 1985:List of 12 ## ..$ coefficients : Named num [1:2] 5.37e-02 -6.93e-06 ## .. ..- attr(*, "names")= chr [1:2] "(Intercept)" "pce" ## ..$ residuals : Named num [1:12] -5.19e-05 -3.49e-04 -2.39e-04 4.79e-05 -1.13e-04 ... ## .. ..- attr(*, "names")= chr [1:12] "1" "2" "3" "4" ... ## ..$ effects : Named num [1:12] -0.120795 -0.00147 -0.000172 0.000101 -0.000107 ... ## .. ..- attr(*, "names")= chr [1:12] "(Intercept)" "pce" "" "" ... ## ..$ rank : int 2 ## ..$ fitted.values: Named num [1:12] 0.0355 0.0354 0.0353 0.0352 0.035 ... ## .. ..- attr(*, "names")= chr [1:12] "1" "2" "3" "4" ... ## ..$ assign : int [1:2] 0 1 ## ..$ qr :List of 5 ## .. ..$ qr : num [1:12, 1:2] -3.464 0.289 0.289 0.289 0.289 ... ## .. .. ..- attr(*, "dimnames")=List of 2 ## .. .. .. ..$ : chr [1:12] "1" "2" "3" "4" ... ## .. .. .. ..$ : chr [1:2] "(Intercept)" "pce" ## .. .. ..- attr(*, "assign")= int [1:2] 0 1 ## .. ..$ qraux: num [1:2] 1.29 1.24 ## .. ..$ pivot: int [1:2] 1 2 ## .. ..$ tol : num 1e-07 ## .. ..$ rank : int 2 ## .. ..- attr(*, "class")= chr "qr" ## ..$ df.residual : int 10 ## ..$ xlevels : Named list() ## ..$ call : language lm(formula = percent ~ pce, data = .x) ## ..$ terms :Classes 'terms', 'formula' language percent ~ pce ## .. .. ..- attr(*, "variables")= language list(percent, pce) ## .. .. ..- attr(*, "factors")= int [1:2, 1] 0 1 ## .. .. .. ..- attr(*, "dimnames")=List of 2 ## .. .. .. .. ..$ : chr [1:2] "percent" "pce" ## .. .. .. .. ..$ : chr "pce" ## .. .. ..- attr(*, "term.labels")= chr "pce" ## .. .. ..- attr(*, "order")= int 1 ## .. .. ..- attr(*, "intercept")= int 1 ## .. .. ..- attr(*, "response")= int 1 ## .. .. ..- attr(*, ".Environment")=<environment: 0x7f8010ea4410> ## .. .. ..- attr(*, "predvars")= language list(percent, pce) ## .. .. ..- attr(*, "dataClasses")= Named chr [1:2] "numeric" "numeric" ## .. .. .. ..- attr(*, "names")= chr [1:2] "percent" "pce" ## ..$ model :'data.frame': 12 obs. of 2 variables: ## .. ..$ percent: num [1:12] 0.0355 0.035 0.0351 0.0353 0.0349 ... ## .. ..$ pce : num [1:12] 2619 2641 2648 2660 2696 ... ## .. ..- attr(*, "terms")=Classes 'terms', 'formula' language percent ~ pce ## .. .. .. ..- attr(*, "variables")= language list(percent, pce) ## .. .. .. ..- attr(*, "factors")= int [1:2, 1] 0 1 ## .. .. .. .. ..- attr(*, "dimnames")=List of 2 ## .. .. .. .. .. ..$ : chr [1:2] "percent" "pce" ## .. .. .. .. .. ..$ : chr "pce" ## .. .. .. ..- attr(*, "term.labels")= chr "pce" ## .. .. .. ..- attr(*, "order")= int 1 ## .. .. .. ..- attr(*, "intercept")= int 1 ## .. .. .. ..- attr(*, "response")= int 1 ## .. .. .. ..- attr(*, ".Environment")=<environment: 0x7f8010ea4410> ## .. .. .. ..- attr(*, "predvars")= language list(percent, pce) ## .. .. .. ..- attr(*, "dataClasses")= Named chr [1:2] "numeric" "numeric" ## .. .. .. .. ..- attr(*, "names")= chr [1:2] "percent" "pce" ## ..- attr(*, "class")= chr "lm" ## $ 1986:List of 12 ## ..$ coefficients : Named num [1:2] 5.38e-02 -6.78e-06 ## .. ..- attr(*, "names")= chr [1:2] "(Intercept)" "pce" ## ..$ residuals : Named num [1:12] -0.002143 0.000321 0.000244 0.00022 0.000657 ... ## .. ..- attr(*, "names")= chr [1:12] "1" "2" "3" "4" ... ## ..$ effects : Named num [1:12] -0.118716 -0.001349 0.000567 0.000579 0.001088 ... ## .. ..- attr(*, "names")= chr [1:12] "(Intercept)" "pce" "" "" ... ## ..$ rank : int 2 ## ..$ fitted.values: Named num [1:12] 0.0347 0.0347 0.0347 0.0346 0.0345 ... ## .. ..- attr(*, "names")= chr [1:12] "1" "2" "3" "4" ... ## ..$ assign : int [1:2] 0 1 ## ..$ qr :List of 5 ## .. ..$ qr : num [1:12, 1:2] -3.464 0.289 0.289 0.289 0.289 ... ## .. .. ..- attr(*, "dimnames")=List of 2 ## .. .. .. ..$ : chr [1:12] "1" "2" "3" "4" ... ## .. .. .. ..$ : chr [1:2] "(Intercept)" "pce" ## .. .. ..- attr(*, "assign")= int [1:2] 0 1 ## .. ..$ qraux: num [1:2] 1.29 1.27 ## .. ..$ pivot: int [1:2] 1 2 ## .. ..$ tol : num 1e-07 ## .. ..$ rank : int 2 ## .. ..- attr(*, "class")= chr "qr" ## ..$ df.residual : int 10 ## ..$ xlevels : Named list() ## ..$ call : language lm(formula = percent ~ pce, data = .x) ## ..$ terms :Classes 'terms', 'formula' language percent ~ pce ## .. .. ..- attr(*, "variables")= language list(percent, pce) ## .. .. ..- attr(*, "factors")= int [1:2, 1] 0 1 ## .. .. .. ..- attr(*, "dimnames")=List of 2 ## .. .. .. .. ..$ : chr [1:2] "percent" "pce" ## .. .. .. .. ..$ : chr "pce" ## .. .. ..- attr(*, "term.labels")= chr "pce" ## .. .. ..- attr(*, "order")= int 1 ## .. .. ..- attr(*, "intercept")= int 1 ## .. .. ..- attr(*, "response")= int 1 ## .. .. ..- attr(*, ".Environment")=<environment: 0x7f8010f41a00> ## .. .. ..- attr(*, "predvars")= language list(percent, pce) ## .. .. ..- attr(*, "dataClasses")= Named chr [1:2] "numeric" "numeric" ## .. .. .. ..- attr(*, "names")= chr [1:2] "percent" "pce" ## ..$ model :'data.frame': 12 obs. of 2 variables: ## .. ..$ percent: num [1:12] 0.0325 0.035 0.0349 0.0348 0.0351 ... ## .. ..$ pce : num [1:12] 2827 2820 2824 2835 2858 ... ## .. ..- attr(*, "terms")=Classes 'terms', 'formula' language percent ~ pce ## .. .. .. ..- attr(*, "variables")= language list(percent, pce) ## .. .. .. ..- attr(*, "factors")= int [1:2, 1] 0 1 ## .. .. .. .. ..- attr(*, "dimnames")=List of 2 ## .. .. .. .. .. ..$ : chr [1:2] "percent" "pce" ## .. .. .. .. .. ..$ : chr "pce" ## .. .. .. ..- attr(*, "term.labels")= chr "pce" ## .. .. .. ..- attr(*, "order")= int 1 ## .. .. .. ..- attr(*, "intercept")= int 1 ## .. .. .. ..- attr(*, "response")= int 1 ## .. .. .. ..- attr(*, ".Environment")=<environment: 0x7f8010f41a00> ## .. .. .. ..- attr(*, "predvars")= language list(percent, pce) ## .. .. .. ..- attr(*, "dataClasses")= Named chr [1:2] "numeric" "numeric" ## .. .. .. .. ..- attr(*, "names")= chr [1:2] "percent" "pce" ## ..- attr(*, "class")= chr "lm" ## $ 1987:List of 12 ## ..$ coefficients : Named num [1:2] 9.15e-02 -1.98e-05 ## .. ..- attr(*, "names")= chr [1:2] "(Intercept)" "pce" ## ..$ residuals : Named num [1:12] -0.00069 0.000489 0.000687 -0.000152 0.000148 ... ## .. ..- attr(*, "names")= chr [1:12] "1" "2" "3" "4" ... ## ..$ effects : Named num [1:12] -1.06e-01 -4.64e-03 7.68e-04 -1.16e-05 3.11e-04 ... ## .. ..- attr(*, "names")= chr [1:12] "(Intercept)" "pce" "" "" ... ## ..$ rank : int 2 ## ..$ fitted.values: Named num [1:12] 0.0333 0.032 0.0318 0.0313 0.0311 ... ## .. ..- attr(*, "names")= chr [1:12] "1" "2" "3" "4" ... ## ..$ assign : int [1:2] 0 1 ## ..$ qr :List of 5 ## .. ..$ qr : num [1:12, 1:2] -3.464 0.289 0.289 0.289 0.289 ... ## .. .. ..- attr(*, "dimnames")=List of 2 ## .. .. .. ..$ : chr [1:12] "1" "2" "3" "4" ... ## .. .. .. ..$ : chr [1:2] "(Intercept)" "pce" ## .. .. ..- attr(*, "assign")= int [1:2] 0 1 ## .. ..$ qraux: num [1:2] 1.29 1.18 ## .. ..$ pivot: int [1:2] 1 2 ## .. ..$ tol : num 1e-07 ## .. ..$ rank : int 2 ## .. ..- attr(*, "class")= chr "qr" ## ..$ df.residual : int 10 ## ..$ xlevels : Named list() ## ..$ call : language lm(formula = percent ~ pce, data = .x) ## ..$ terms :Classes 'terms', 'formula' language percent ~ pce ## .. .. ..- attr(*, "variables")= language list(percent, pce) ## .. .. ..- attr(*, "factors")= int [1:2, 1] 0 1 ## .. .. .. ..- attr(*, "dimnames")=List of 2 ## .. .. .. .. ..$ : chr [1:2] "percent" "pce" ## .. .. .. .. ..$ : chr "pce" ## .. .. ..- attr(*, "term.labels")= chr "pce" ## .. .. ..- attr(*, "order")= int 1 ## .. .. ..- attr(*, "intercept")= int 1 ## .. .. ..- attr(*, "response")= int 1 ## .. .. ..- attr(*, ".Environment")=<environment: 0x7f80745722e8> ## .. .. ..- attr(*, "predvars")= language list(percent, pce) ## .. .. ..- attr(*, "dataClasses")= Named chr [1:2] "numeric" "numeric" ## .. .. .. ..- attr(*, "names")= chr [1:2] "percent" "pce" ## ..$ model :'data.frame': 12 obs. of 2 variables: ## .. ..$ percent: num [1:12] 0.0326 0.0325 0.0325 0.0311 0.0312 ... ## .. ..$ pce : num [1:12] 2936 3002 3013 3039 3048 ... ## .. ..- attr(*, "terms")=Classes 'terms', 'formula' language percent ~ pce ## .. .. .. ..- attr(*, "variables")= language list(percent, pce) ## .. .. .. ..- attr(*, "factors")= int [1:2, 1] 0 1 ## .. .. .. .. ..- attr(*, "dimnames")=List of 2 ## .. .. .. .. .. ..$ : chr [1:2] "percent" "pce" ## .. .. .. .. .. ..$ : chr "pce" ## .. .. .. ..- attr(*, "term.labels")= chr "pce" ## .. .. .. ..- attr(*, "order")= int 1 ## .. .. .. ..- attr(*, "intercept")= int 1 ## .. .. .. ..- attr(*, "response")= int 1 ## .. .. .. ..- attr(*, ".Environment")=<environment: 0x7f80745722e8> ## .. .. .. ..- attr(*, "predvars")= language list(percent, pce) ## .. .. .. ..- attr(*, "dataClasses")= Named chr [1:2] "numeric" "numeric" ## .. .. .. .. ..- attr(*, "names")= chr [1:2] "percent" "pce" ## ..- attr(*, "class")= chr "lm" ## $ 1988:List of 12 ## ..$ coefficients : Named num [1:2] 5.12e-02 -7.17e-06 ## .. ..- attr(*, "names")= chr [1:2] "(Intercept)" "pce" ## ..$ residuals : Named num [1:12] 0.000326 0.000265 0.000311 -0.000815 0.000114 ... ## .. ..- attr(*, "names")= chr [1:12] "1" "2" "3" "4" ... ## ..$ effects : Named num [1:12] -9.47e-02 -1.95e-03 2.15e-04 -9.10e-04 3.56e-05 ... ## .. ..- attr(*, "names")= chr [1:12] "(Intercept)" "pce" "" "" ... ## ..$ rank : int 2 ## ..$ fitted.values: Named num [1:12] 0.0282 0.0281 0.0278 0.0278 0.0276 ... ## .. ..- attr(*, "names")= chr [1:12] "1" "2" "3" "4" ... ## ..$ assign : int [1:2] 0 1 ## ..$ qr :List of 5 ## .. ..$ qr : num [1:12, 1:2] -3.464 0.289 0.289 0.289 0.289 ... ## .. .. ..- attr(*, "dimnames")=List of 2 ## .. .. .. ..$ : chr [1:12] "1" "2" "3" "4" ... ## .. .. .. ..$ : chr [1:2] "(Intercept)" "pce" ## .. .. ..- attr(*, "assign")= int [1:2] 0 1 ## .. ..$ qraux: num [1:2] 1.29 1.3 ## .. ..$ pivot: int [1:2] 1 2 ## .. ..$ tol : num 1e-07 ## .. ..$ rank : int 2 ## .. ..- attr(*, "class")= chr "qr" ## ..$ df.residual : int 10 ## ..$ xlevels : Named list() ## ..$ call : language lm(formula = percent ~ pce, data = .x) ## ..$ terms :Classes 'terms', 'formula' language percent ~ pce ## .. .. ..- attr(*, "variables")= language list(percent, pce) ## .. .. ..- attr(*, "factors")= int [1:2, 1] 0 1 ## .. .. .. ..- attr(*, "dimnames")=List of 2 ## .. .. .. .. ..$ : chr [1:2] "percent" "pce" ## .. .. .. .. ..$ : chr "pce" ## .. .. ..- attr(*, "term.labels")= chr "pce" ## .. .. ..- attr(*, "order")= int 1 ## .. .. ..- attr(*, "intercept")= int 1 ## .. .. ..- attr(*, "response")= int 1 ## .. .. ..- attr(*, ".Environment")=<environment: 0x7f8012581388> ## .. .. ..- attr(*, "predvars")= language list(percent, pce) ## .. .. ..- attr(*, "dataClasses")= Named chr [1:2] "numeric" "numeric" ## .. .. .. ..- attr(*, "names")= chr [1:2] "percent" "pce" ## ..$ model :'data.frame': 12 obs. of 2 variables: ## .. ..$ percent: num [1:12] 0.0285 0.0284 0.0281 0.027 0.0277 ... ## .. ..$ pce : num [1:12] 3214 3221 3260 3263 3294 ... ## .. ..- attr(*, "terms")=Classes 'terms', 'formula' language percent ~ pce ## .. .. .. ..- attr(*, "variables")= language list(percent, pce) ## .. .. .. ..- attr(*, "factors")= int [1:2, 1] 0 1 ## .. .. .. .. ..- attr(*, "dimnames")=List of 2 ## .. .. .. .. .. ..$ : chr [1:2] "percent" "pce" ## .. .. .. .. .. ..$ : chr "pce" ## .. .. .. ..- attr(*, "term.labels")= chr "pce" ## .. .. .. ..- attr(*, "order")= int 1 ## .. .. .. ..- attr(*, "intercept")= int 1 ## .. .. .. ..- attr(*, "response")= int 1 ## .. .. .. ..- attr(*, ".Environment")=<environment: 0x7f8012581388> ## .. .. .. ..- attr(*, "predvars")= language list(percent, pce) ## .. .. .. ..- attr(*, "dataClasses")= Named chr [1:2] "numeric" "numeric" ## .. .. .. .. ..- attr(*, "names")= chr [1:2] "percent" "pce" ## ..- attr(*, "class")= chr "lm" ## $ 1989:List of 12 ## ..$ coefficients : Named num [1:2] 1.05e-02 4.44e-06 ## .. ..- attr(*, "names")= chr [1:2] "(Intercept)" "pce" ## ..$ residuals : Named num [1:12] 1.17e-03 -1.76e-04 -8.65e-04 -1.46e-05 -4.50e-04 ... ## .. ..- attr(*, "names")= chr [1:12] "1" "2" "3" "4" ... ## ..$ effects : Named num [1:12] -0.091384 0.000969 -0.00104 -0.000257 -0.000706 ... ## .. ..- attr(*, "names")= chr [1:12] "(Intercept)" "pce" "" "" ... ## ..$ rank : int 2 ## ..$ fitted.values: Named num [1:12] 0.026 0.026 0.026 0.0262 0.0263 ... ## .. ..- attr(*, "names")= chr [1:12] "1" "2" "3" "4" ... ## ..$ assign : int [1:2] 0 1 ## ..$ qr :List of 5 ## .. ..$ qr : num [1:12, 1:2] -3.464 0.289 0.289 0.289 0.289 ... ## .. .. ..- attr(*, "dimnames")=List of 2 ## .. .. .. ..$ : chr [1:12] "1" "2" "3" "4" ... ## .. .. .. ..$ : chr [1:2] "(Intercept)" "pce" ## .. .. ..- attr(*, "assign")= int [1:2] 0 1 ## .. ..$ qraux: num [1:2] 1.29 1.31 ## .. ..$ pivot: int [1:2] 1 2 ## .. ..$ tol : num 1e-07 ## .. ..$ rank : int 2 ## .. ..- attr(*, "class")= chr "qr" ## ..$ df.residual : int 10 ## ..$ xlevels : Named list() ## ..$ call : language lm(formula = percent ~ pce, data = .x) ## ..$ terms :Classes 'terms', 'formula' language percent ~ pce ## .. .. ..- attr(*, "variables")= language list(percent, pce) ## .. .. ..- attr(*, "factors")= int [1:2, 1] 0 1 ## .. .. .. ..- attr(*, "dimnames")=List of 2 ## .. .. .. .. ..$ : chr [1:2] "percent" "pce" ## .. .. .. .. ..$ : chr "pce" ## .. .. ..- attr(*, "term.labels")= chr "pce" ## .. .. ..- attr(*, "order")= int 1 ## .. .. ..- attr(*, "intercept")= int 1 ## .. .. ..- attr(*, "response")= int 1 ## .. .. ..- attr(*, ".Environment")=<environment: 0x7f801262dc20> ## .. .. ..- attr(*, "predvars")= language list(percent, pce) ## .. .. ..- attr(*, "dataClasses")= Named chr [1:2] "numeric" "numeric" ## .. .. .. ..- attr(*, "names")= chr [1:2] "percent" "pce" ## ..$ model :'data.frame': 12 obs. of 2 variables: ## .. ..$ percent: num [1:12] 0.0271 0.0258 0.0252 0.0262 0.0258 ... ## .. ..$ pce : num [1:12] 3484 3488 3499 3543 3552 ... ## .. ..- attr(*, "terms")=Classes 'terms', 'formula' language percent ~ pce ## .. .. .. ..- attr(*, "variables")= language list(percent, pce) ## .. .. .. ..- attr(*, "factors")= int [1:2, 1] 0 1 ## .. .. .. .. ..- attr(*, "dimnames")=List of 2 ## .. .. .. .. .. ..$ : chr [1:2] "percent" "pce" ## .. .. .. .. .. ..$ : chr "pce" ## .. .. .. ..- attr(*, "term.labels")= chr "pce" ## .. .. .. ..- attr(*, "order")= int 1 ## .. .. .. ..- attr(*, "intercept")= int 1 ## .. .. .. ..- attr(*, "response")= int 1 ## .. .. .. ..- attr(*, ".Environment")=<environment: 0x7f801262dc20> ## .. .. .. ..- attr(*, "predvars")= language list(percent, pce) ## .. .. .. ..- attr(*, "dataClasses")= Named chr [1:2] "numeric" "numeric" ## .. .. .. .. ..- attr(*, "names")= chr [1:2] "percent" "pce" ## ..- attr(*, "class")= chr "lm" ## $ 1990:List of 12 ## ..$ coefficients : Named num [1:2] -7.12e-02 2.61e-05 ## .. ..- attr(*, "names")= chr [1:2] "(Intercept)" "pce" ## ..$ residuals : Named num [1:12] 9.66e-04 6.07e-04 -3.23e-04 4.93e-05 -3.51e-04 ... ## .. ..- attr(*, "names")= chr [1:12] "1" "2" "3" "4" ... ## ..$ effects : Named num [1:12] -0.097801 0.004826 -0.000597 -0.000201 -0.000592 ... ## .. ..- attr(*, "names")= chr [1:12] "(Intercept)" "pce" "" "" ... ## ..$ rank : int 2 ## ..$ fitted.values: Named num [1:12] 0.0262 0.0261 0.0268 0.0272 0.0274 ... ## .. ..- attr(*, "names")= chr [1:12] "1" "2" "3" "4" ... ## ..$ assign : int [1:2] 0 1 ## ..$ qr :List of 5 ## .. ..$ qr : num [1:12, 1:2] -3.464 0.289 0.289 0.289 0.289 ... ## .. .. ..- attr(*, "dimnames")=List of 2 ## .. .. .. ..$ : chr [1:12] "1" "2" "3" "4" ... ## .. .. .. ..$ : chr [1:2] "(Intercept)" "pce" ## .. .. ..- attr(*, "assign")= int [1:2] 0 1 ## .. ..$ qraux: num [1:2] 1.29 1.34 ## .. ..$ pivot: int [1:2] 1 2 ## .. ..$ tol : num 1e-07 ## .. ..$ rank : int 2 ## .. ..- attr(*, "class")= chr "qr" ## ..$ df.residual : int 10 ## ..$ xlevels : Named list() ## ..$ call : language lm(formula = percent ~ pce, data = .x) ## ..$ terms :Classes 'terms', 'formula' language percent ~ pce ## .. .. ..- attr(*, "variables")= language list(percent, pce) ## .. .. ..- attr(*, "factors")= int [1:2, 1] 0 1 ## .. .. .. ..- attr(*, "dimnames")=List of 2 ## .. .. .. .. ..$ : chr [1:2] "percent" "pce" ## .. .. .. .. ..$ : chr "pce" ## .. .. ..- attr(*, "term.labels")= chr "pce" ## .. .. ..- attr(*, "order")= int 1 ## .. .. ..- attr(*, "intercept")= int 1 ## .. .. ..- attr(*, "response")= int 1 ## .. .. ..- attr(*, ".Environment")=<environment: 0x7f8012739878> ## .. .. ..- attr(*, "predvars")= language list(percent, pce) ## .. .. ..- attr(*, "dataClasses")= Named chr [1:2] "numeric" "numeric" ## .. .. .. ..- attr(*, "names")= chr [1:2] "percent" "pce" ## ..$ model :'data.frame': 12 obs. of 2 variables: ## .. ..$ percent: num [1:12] 0.0272 0.0267 0.0265 0.0273 0.027 ... ## .. ..$ pce : num [1:12] 3731 3728 3755 3770 3776 ... ## .. ..- attr(*, "terms")=Classes 'terms', 'formula' language percent ~ pce ## .. .. .. ..- attr(*, "variables")= language list(percent, pce) ## .. .. .. ..- attr(*, "factors")= int [1:2, 1] 0 1 ## .. .. .. .. ..- attr(*, "dimnames")=List of 2 ## .. .. .. .. .. ..$ : chr [1:2] "percent" "pce" ## .. .. .. .. .. ..$ : chr "pce" ## .. .. .. ..- attr(*, "term.labels")= chr "pce" ## .. .. .. ..- attr(*, "order")= int 1 ## .. .. .. ..- attr(*, "intercept")= int 1 ## .. .. .. ..- attr(*, "response")= int 1 ## .. .. .. ..- attr(*, ".Environment")=<environment: 0x7f8012739878> ## .. .. .. ..- attr(*, "predvars")= language list(percent, pce) ## .. .. .. ..- attr(*, "dataClasses")= Named chr [1:2] "numeric" "numeric" ## .. .. .. .. ..- attr(*, "names")= chr [1:2] "percent" "pce" ## ..- attr(*, "class")= chr "lm" ## $ 1991:List of 12 ## ..$ coefficients : Named num [1:2] -3.86e-02 1.84e-05 ## .. ..- attr(*, "names")= chr [1:2] "(Intercept)" "pce" ## ..$ residuals : Named num [1:12] -3.86e-04 1.01e-04 4.89e-04 -2.06e-05 6.37e-04 ... ## .. ..- attr(*, "names")= chr [1:12] "1" "2" "3" "4" ... ## ..$ effects : Named num [1:12] -1.18e-01 3.31e-03 5.69e-04 5.51e-05 7.34e-04 ... ## .. ..- attr(*, "names")= chr [1:12] "(Intercept)" "pce" "" "" ... ## ..$ rank : int 2 ## ..$ fitted.values: Named num [1:12] 0.0322 0.0327 0.0335 0.0334 0.0339 ... ## .. ..- attr(*, "names")= chr [1:12] "1" "2" "3" "4" ... ## ..$ assign : int [1:2] 0 1 ## ..$ qr :List of 5 ## .. ..$ qr : num [1:12, 1:2] -3.464 0.289 0.289 0.289 0.289 ... ## .. .. ..- attr(*, "dimnames")=List of 2 ## .. .. .. ..$ : chr [1:12] "1" "2" "3" "4" ... ## .. .. .. ..$ : chr [1:2] "(Intercept)" "pce" ## .. .. ..- attr(*, "assign")= int [1:2] 0 1 ## .. ..$ qraux: num [1:2] 1.29 1.3 ## .. ..$ pivot: int [1:2] 1 2 ## .. ..$ tol : num 1e-07 ## .. ..$ rank : int 2 ## .. ..- attr(*, "class")= chr "qr" ## ..$ df.residual : int 10 ## ..$ xlevels : Named list() ## ..$ call : language lm(formula = percent ~ pce, data = .x) ## ..$ terms :Classes 'terms', 'formula' language percent ~ pce ## .. .. ..- attr(*, "variables")= language list(percent, pce) ## .. .. ..- attr(*, "factors")= int [1:2, 1] 0 1 ## .. .. .. ..- attr(*, "dimnames")=List of 2 ## .. .. .. .. ..$ : chr [1:2] "percent" "pce" ## .. .. .. .. ..$ : chr "pce" ## .. .. ..- attr(*, "term.labels")= chr "pce" ## .. .. ..- attr(*, "order")= int 1 ## .. .. ..- attr(*, "intercept")= int 1 ## .. .. ..- attr(*, "response")= int 1 ## .. .. ..- attr(*, ".Environment")=<environment: 0x7f801282f0e8> ## .. .. ..- attr(*, "predvars")= language list(percent, pce) ## .. .. ..- attr(*, "dataClasses")= Named chr [1:2] "numeric" "numeric" ## .. .. .. ..- attr(*, "names")= chr [1:2] "percent" "pce" ## ..$ model :'data.frame': 12 obs. of 2 variables: ## .. ..$ percent: num [1:12] 0.0318 0.0328 0.034 0.0334 0.0345 ... ## .. ..$ pce : num [1:12] 3841 3867 3913 3907 3933 ... ## .. ..- attr(*, "terms")=Classes 'terms', 'formula' language percent ~ pce ## .. .. .. ..- attr(*, "variables")= language list(percent, pce) ## .. .. .. ..- attr(*, "factors")= int [1:2, 1] 0 1 ## .. .. .. .. ..- attr(*, "dimnames")=List of 2 ## .. .. .. .. .. ..$ : chr [1:2] "percent" "pce" ## .. .. .. .. .. ..$ : chr "pce" ## .. .. .. ..- attr(*, "term.labels")= chr "pce" ## .. .. .. ..- attr(*, "order")= int 1 ## .. .. .. ..- attr(*, "intercept")= int 1 ## .. .. .. ..- attr(*, "response")= int 1 ## .. .. .. ..- attr(*, ".Environment")=<environment: 0x7f801282f0e8> ## .. .. .. ..- attr(*, "predvars")= language list(percent, pce) ## .. .. .. ..- attr(*, "dataClasses")= Named chr [1:2] "numeric" "numeric" ## .. .. .. .. ..- attr(*, "names")= chr [1:2] "percent" "pce" ## ..- attr(*, "class")= chr "lm" ## $ 1992:List of 12 ## ..$ coefficients : Named num [1:2] 3.49e-02 6.09e-07 ## .. ..- attr(*, "names")= chr [1:2] "(Intercept)" "pce" ## ..$ residuals : Named num [1:12] -0.000987 -0.00036 -0.000385 -0.000611 0.000614 ... ## .. ..- attr(*, "names")= chr [1:12] "1" "2" "3" "4" ... ## ..$ effects : Named num [1:12] -0.12966 0.000169 -0.000141 -0.000373 0.000841 ... ## .. ..- attr(*, "names")= chr [1:12] "(Intercept)" "pce" "" "" ... ## ..$ rank : int 2 ## ..$ fitted.values: Named num [1:12] 0.0374 0.0374 0.0374 0.0374 0.0374 ... ## .. ..- attr(*, "names")= chr [1:12] "1" "2" "3" "4" ... ## ..$ assign : int [1:2] 0 1 ## ..$ qr :List of 5 ## .. ..$ qr : num [1:12, 1:2] -3.464 0.289 0.289 0.289 0.289 ... ## .. .. ..- attr(*, "dimnames")=List of 2 ## .. .. .. ..$ : chr [1:12] "1" "2" "3" "4" ... ## .. .. .. ..$ : chr [1:2] "(Intercept)" "pce" ## .. .. ..- attr(*, "assign")= int [1:2] 0 1 ## .. ..$ qraux: num [1:2] 1.29 1.26 ## .. ..$ pivot: int [1:2] 1 2 ## .. ..$ tol : num 1e-07 ## .. ..$ rank : int 2 ## .. ..- attr(*, "class")= chr "qr" ## ..$ df.residual : int 10 ## ..$ xlevels : Named list() ## ..$ call : language lm(formula = percent ~ pce, data = .x) ## ..$ terms :Classes 'terms', 'formula' language percent ~ pce ## .. .. ..- attr(*, "variables")= language list(percent, pce) ## .. .. ..- attr(*, "factors")= int [1:2, 1] 0 1 ## .. .. .. ..- attr(*, "dimnames")=List of 2 ## .. .. .. .. ..$ : chr [1:2] "percent" "pce" ## .. .. .. .. ..$ : chr "pce" ## .. .. ..- attr(*, "term.labels")= chr "pce" ## .. .. ..- attr(*, "order")= int 1 ## .. .. ..- attr(*, "intercept")= int 1 ## .. .. ..- attr(*, "response")= int 1 ## .. .. ..- attr(*, ".Environment")=<environment: 0x7f80128ea710> ## .. .. ..- attr(*, "predvars")= language list(percent, pce) ## .. .. ..- attr(*, "dataClasses")= Named chr [1:2] "numeric" "numeric" ## .. .. .. ..- attr(*, "names")= chr [1:2] "percent" "pce" ## ..$ model :'data.frame': 12 obs. of 2 variables: ## .. ..$ percent: num [1:12] 0.0364 0.037 0.037 0.0368 0.038 ... ## .. ..$ pce : num [1:12] 4085 4100 4117 4132 4158 ... ## .. ..- attr(*, "terms")=Classes 'terms', 'formula' language percent ~ pce ## .. .. .. ..- attr(*, "variables")= language list(percent, pce) ## .. .. .. ..- attr(*, "factors")= int [1:2, 1] 0 1 ## .. .. .. .. ..- attr(*, "dimnames")=List of 2 ## .. .. .. .. .. ..$ : chr [1:2] "percent" "pce" ## .. .. .. .. .. ..$ : chr "pce" ## .. .. .. ..- attr(*, "term.labels")= chr "pce" ## .. .. .. ..- attr(*, "order")= int 1 ## .. .. .. ..- attr(*, "intercept")= int 1 ## .. .. .. ..- attr(*, "response")= int 1 ## .. .. .. ..- attr(*, ".Environment")=<environment: 0x7f80128ea710> ## .. .. .. ..- attr(*, "predvars")= language list(percent, pce) ## .. .. .. ..- attr(*, "dataClasses")= Named chr [1:2] "numeric" "numeric" ## .. .. .. .. ..- attr(*, "names")= chr [1:2] "percent" "pce" ## ..- attr(*, "class")= chr "lm" ## $ 1993:List of 12 ## ..$ coefficients : Named num [1:2] 9.54e-02 -1.37e-05 ## .. ..- attr(*, "names")= chr [1:2] "(Intercept)" "pce" ## ..$ residuals : Named num [1:12] 2.04e-04 -1.77e-04 -7.38e-04 -3.91e-06 5.08e-04 ... ## .. ..- attr(*, "names")= chr [1:12] "1" "2" "3" "4" ... ## ..$ effects : Named num [1:12] -1.19e-01 -3.68e-03 -7.35e-04 -2.76e-05 4.65e-04 ... ## .. ..- attr(*, "names")= chr [1:12] "(Intercept)" "pce" "" "" ... ## ..$ rank : int 2 ## ..$ fitted.values: Named num [1:12] 0.0358 0.0356 0.0357 0.0351 0.0347 ... ## .. ..- attr(*, "names")= chr [1:12] "1" "2" "3" "4" ... ## ..$ assign : int [1:2] 0 1 ## ..$ qr :List of 5 ## .. ..$ qr : num [1:12, 1:2] -3.464 0.289 0.289 0.289 0.289 ... ## .. .. ..- attr(*, "dimnames")=List of 2 ## .. .. .. ..$ : chr [1:12] "1" "2" "3" "4" ... ## .. .. .. ..$ : chr [1:2] "(Intercept)" "pce" ## .. .. ..- attr(*, "assign")= int [1:2] 0 1 ## .. ..$ qraux: num [1:2] 1.29 1.27 ## .. ..$ pivot: int [1:2] 1 2 ## .. ..$ tol : num 1e-07 ## .. ..$ rank : int 2 ## .. ..- attr(*, "class")= chr "qr" ## ..$ df.residual : int 10 ## ..$ xlevels : Named list() ## ..$ call : language lm(formula = percent ~ pce, data = .x) ## ..$ terms :Classes 'terms', 'formula' language percent ~ pce ## .. .. ..- attr(*, "variables")= language list(percent, pce) ## .. .. ..- attr(*, "factors")= int [1:2, 1] 0 1 ## .. .. .. ..- attr(*, "dimnames")=List of 2 ## .. .. .. .. ..$ : chr [1:2] "percent" "pce" ## .. .. .. .. ..$ : chr "pce" ## .. .. ..- attr(*, "term.labels")= chr "pce" ## .. .. ..- attr(*, "order")= int 1 ## .. .. ..- attr(*, "intercept")= int 1 ## .. .. ..- attr(*, "response")= int 1 ## .. .. ..- attr(*, ".Environment")=<environment: 0x7f801298cb00> ## .. .. ..- attr(*, "predvars")= language list(percent, pce) ## .. .. ..- attr(*, "dataClasses")= Named chr [1:2] "numeric" "numeric" ## .. .. .. ..- attr(*, "names")= chr [1:2] "percent" "pce" ## ..$ model :'data.frame': 12 obs. of 2 variables: ## .. ..$ percent: num [1:12] 0.036 0.0355 0.0349 0.0351 0.0352 ... ## .. ..$ pce : num [1:12] 4341 4355 4352 4393 4422 ... ## .. ..- attr(*, "terms")=Classes 'terms', 'formula' language percent ~ pce ## .. .. .. ..- attr(*, "variables")= language list(percent, pce) ## .. .. .. ..- attr(*, "factors")= int [1:2, 1] 0 1 ## .. .. .. .. ..- attr(*, "dimnames")=List of 2 ## .. .. .. .. .. ..$ : chr [1:2] "percent" "pce" ## .. .. .. .. .. ..$ : chr "pce" ## .. .. .. ..- attr(*, "term.labels")= chr "pce" ## .. .. .. ..- attr(*, "order")= int 1 ## .. .. .. ..- attr(*, "intercept")= int 1 ## .. .. .. ..- attr(*, "response")= int 1 ## .. .. .. ..- attr(*, ".Environment")=<environment: 0x7f801298cb00> ## .. .. .. ..- attr(*, "predvars")= language list(percent, pce) ## .. .. .. ..- attr(*, "dataClasses")= Named chr [1:2] "numeric" "numeric" ## .. .. .. .. ..- attr(*, "names")= chr [1:2] "percent" "pce" ## ..- attr(*, "class")= chr "lm" ## $ 1994:List of 12 ## ..$ coefficients : Named num [1:2] 1.3e-01 -2.1e-05 ## .. ..- attr(*, "names")= chr [1:2] "(Intercept)" "pce" ## ..$ residuals : Named num [1:12] -0.000201 0.000593 0.000415 0.000379 -0.001266 ... ## .. ..- attr(*, "names")= chr [1:12] "1" "2" "3" "4" ... ## ..$ effects : Named num [1:12] -0.104941 -0.005787 0.000375 0.000387 -0.001262 ... ## .. ..- attr(*, "names")= chr [1:12] "(Intercept)" "pce" "" "" ... ## ..$ rank : int 2 ## ..$ fitted.values: Named num [1:12] 0.0332 0.0322 0.0319 0.0313 0.0314 ... ## .. ..- attr(*, "names")= chr [1:12] "1" "2" "3" "4" ... ## ..$ assign : int [1:2] 0 1 ## ..$ qr :List of 5 ## .. ..$ qr : num [1:12, 1:2] -3.464 0.289 0.289 0.289 0.289 ... ## .. .. ..- attr(*, "dimnames")=List of 2 ## .. .. .. ..$ : chr [1:12] "1" "2" "3" "4" ... ## .. .. .. ..$ : chr [1:2] "(Intercept)" "pce" ## .. .. ..- attr(*, "assign")= int [1:2] 0 1 ## .. ..$ qraux: num [1:2] 1.29 1.21 ## .. ..$ pivot: int [1:2] 1 2 ## .. ..$ tol : num 1e-07 ## .. ..$ rank : int 2 ## .. ..- attr(*, "class")= chr "qr" ## ..$ df.residual : int 10 ## ..$ xlevels : Named list() ## ..$ call : language lm(formula = percent ~ pce, data = .x) ## ..$ terms :Classes 'terms', 'formula' language percent ~ pce ## .. .. ..- attr(*, "variables")= language list(percent, pce) ## .. .. ..- attr(*, "factors")= int [1:2, 1] 0 1 ## .. .. .. ..- attr(*, "dimnames")=List of 2 ## .. .. .. .. ..$ : chr [1:2] "percent" "pce" ## .. .. .. .. ..$ : chr "pce" ## .. .. ..- attr(*, "term.labels")= chr "pce" ## .. .. ..- attr(*, "order")= int 1 ## .. .. ..- attr(*, "intercept")= int 1 ## .. .. ..- attr(*, "response")= int 1 ## .. .. ..- attr(*, ".Environment")=<environment: 0x7f8012a3c3c8> ## .. .. ..- attr(*, "predvars")= language list(percent, pce) ## .. .. ..- attr(*, "dataClasses")= Named chr [1:2] "numeric" "numeric" ## .. .. .. ..- attr(*, "names")= chr [1:2] "percent" "pce" ## ..$ model :'data.frame': 12 obs. of 2 variables: ## .. ..$ percent: num [1:12] 0.0329 0.0327 0.0323 0.0317 0.0301 ... ## .. ..$ pce : num [1:12] 4585 4633 4646 4671 4670 ... ## .. ..- attr(*, "terms")=Classes 'terms', 'formula' language percent ~ pce ## .. .. .. ..- attr(*, "variables")= language list(percent, pce) ## .. .. .. ..- attr(*, "factors")= int [1:2, 1] 0 1 ## .. .. .. .. ..- attr(*, "dimnames")=List of 2 ## .. .. .. .. .. ..$ : chr [1:2] "percent" "pce" ## .. .. .. .. .. ..$ : chr "pce" ## .. .. .. ..- attr(*, "term.labels")= chr "pce" ## .. .. .. ..- attr(*, "order")= int 1 ## .. .. .. ..- attr(*, "intercept")= int 1 ## .. .. .. ..- attr(*, "response")= int 1 ## .. .. .. ..- attr(*, ".Environment")=<environment: 0x7f8012a3c3c8> ## .. .. .. ..- attr(*, "predvars")= language list(percent, pce) ## .. .. .. ..- attr(*, "dataClasses")= Named chr [1:2] "numeric" "numeric" ## .. .. .. .. ..- attr(*, "names")= chr [1:2] "percent" "pce" ## ..- attr(*, "class")= chr "lm" ## $ 1995:List of 12 ## ..$ coefficients : Named num [1:2] 2.40e-02 7.72e-07 ## .. ..- attr(*, "names")= chr [1:2] "(Intercept)" "pce" ## ..$ residuals : Named num [1:12] 0.000114 -0.000618 -0.000796 0.001025 0.000158 ... ## .. ..- attr(*, "names")= chr [1:12] "1" "2" "3" "4" ... ## ..$ effects : Named num [1:12] -0.096293 0.000207 -0.000727 0.001086 0.00014 ... ## .. ..- attr(*, "names")= chr [1:12] "(Intercept)" "pce" "" "" ... ## ..$ rank : int 2 ## ..$ fitted.values: Named num [1:12] 0.0277 0.0277 0.0277 0.0277 0.0278 ... ## .. ..- attr(*, "names")= chr [1:12] "1" "2" "3" "4" ... ## ..$ assign : int [1:2] 0 1 ## ..$ qr :List of 5 ## .. ..$ qr : num [1:12, 1:2] -3.464 0.289 0.289 0.289 0.289 ... ## .. .. ..- attr(*, "dimnames")=List of 2 ## .. .. .. ..$ : chr [1:12] "1" "2" "3" "4" ... ## .. .. .. ..$ : chr [1:2] "(Intercept)" "pce" ## .. .. ..- attr(*, "assign")= int [1:2] 0 1 ## .. ..$ qraux: num [1:2] 1.29 1.32 ## .. ..$ pivot: int [1:2] 1 2 ## .. ..$ tol : num 1e-07 ## .. ..$ rank : int 2 ## .. ..- attr(*, "class")= chr "qr" ## ..$ df.residual : int 10 ## ..$ xlevels : Named list() ## ..$ call : language lm(formula = percent ~ pce, data = .x) ## ..$ terms :Classes 'terms', 'formula' language percent ~ pce ## .. .. ..- attr(*, "variables")= language list(percent, pce) ## .. .. ..- attr(*, "factors")= int [1:2, 1] 0 1 ## .. .. .. ..- attr(*, "dimnames")=List of 2 ## .. .. .. .. ..$ : chr [1:2] "percent" "pce" ## .. .. .. .. ..$ : chr "pce" ## .. .. ..- attr(*, "term.labels")= chr "pce" ## .. .. ..- attr(*, "order")= int 1 ## .. .. ..- attr(*, "intercept")= int 1 ## .. .. ..- attr(*, "response")= int 1 ## .. .. ..- attr(*, ".Environment")=<environment: 0x7f80130b6438> ## .. .. ..- attr(*, "predvars")= language list(percent, pce) ## .. .. ..- attr(*, "dataClasses")= Named chr [1:2] "numeric" "numeric" ## .. .. .. ..- attr(*, "names")= chr [1:2] "percent" "pce" ## ..$ model :'data.frame': 12 obs. of 2 variables: ## .. ..$ percent: num [1:12] 0.0278 0.0271 0.0269 0.0288 0.0279 ... ## .. ..$ pce : num [1:12] 4851 4851 4885 4890 4933 ... ## .. ..- attr(*, "terms")=Classes 'terms', 'formula' language percent ~ pce ## .. .. .. ..- attr(*, "variables")= language list(percent, pce) ## .. .. .. ..- attr(*, "factors")= int [1:2, 1] 0 1 ## .. .. .. .. ..- attr(*, "dimnames")=List of 2 ## .. .. .. .. .. ..$ : chr [1:2] "percent" "pce" ## .. .. .. .. .. ..$ : chr "pce" ## .. .. .. ..- attr(*, "term.labels")= chr "pce" ## .. .. .. ..- attr(*, "order")= int 1 ## .. .. .. ..- attr(*, "intercept")= int 1 ## .. .. .. ..- attr(*, "response")= int 1 ## .. .. .. ..- attr(*, ".Environment")=<environment: 0x7f80130b6438> ## .. .. .. ..- attr(*, "predvars")= language list(percent, pce) ## .. .. .. ..- attr(*, "dataClasses")= Named chr [1:2] "numeric" "numeric" ## .. .. .. .. ..- attr(*, "names")= chr [1:2] "percent" "pce" ## ..- attr(*, "class")= chr "lm" ## $ 1996:List of 12 ## ..$ coefficients : Named num [1:2] 5.60e-02 -5.57e-06 ## .. ..- attr(*, "names")= chr [1:2] "(Intercept)" "pce" ## ..$ residuals : Named num [1:12] 2.26e-04 -1.97e-04 2.33e-05 5.51e-04 6.43e-04 ... ## .. ..- attr(*, "names")= chr [1:12] "1" "2" "3" "4" ... ## ..$ effects : Named num [1:12] -9.29e-02 -1.62e-03 -3.18e-06 5.01e-04 5.82e-04 ... ## .. ..- attr(*, "names")= chr [1:12] "(Intercept)" "pce" "" "" ... ## ..$ rank : int 2 ## ..$ fitted.values: Named num [1:12] 0.0277 0.0274 0.0272 0.027 0.0269 ... ## .. ..- attr(*, "names")= chr [1:12] "1" "2" "3" "4" ... ## ..$ assign : int [1:2] 0 1 ## ..$ qr :List of 5 ## .. ..$ qr : num [1:12, 1:2] -3.464 0.289 0.289 0.289 0.289 ... ## .. .. ..- attr(*, "dimnames")=List of 2 ## .. .. .. ..$ : chr [1:12] "1" "2" "3" "4" ... ## .. .. .. ..$ : chr [1:2] "(Intercept)" "pce" ## .. .. ..- attr(*, "assign")= int [1:2] 0 1 ## .. ..$ qraux: num [1:2] 1.29 1.26 ## .. ..$ pivot: int [1:2] 1 2 ## .. ..$ tol : num 1e-07 ## .. ..$ rank : int 2 ## .. ..- attr(*, "class")= chr "qr" ## ..$ df.residual : int 10 ## ..$ xlevels : Named list() ## ..$ call : language lm(formula = percent ~ pce, data = .x) ## ..$ terms :Classes 'terms', 'formula' language percent ~ pce ## .. .. ..- attr(*, "variables")= language list(percent, pce) ## .. .. ..- attr(*, "factors")= int [1:2, 1] 0 1 ## .. .. .. ..- attr(*, "dimnames")=List of 2 ## .. .. .. .. ..$ : chr [1:2] "percent" "pce" ## .. .. .. .. ..$ : chr "pce" ## .. .. ..- attr(*, "term.labels")= chr "pce" ## .. .. ..- attr(*, "order")= int 1 ## .. .. ..- attr(*, "intercept")= int 1 ## .. .. ..- attr(*, "response")= int 1 ## .. .. ..- attr(*, ".Environment")=<environment: 0x7f8013205580> ## .. .. ..- attr(*, "predvars")= language list(percent, pce) ## .. .. ..- attr(*, "dataClasses")= Named chr [1:2] "numeric" "numeric" ## .. .. .. ..- attr(*, "names")= chr [1:2] "percent" "pce" ## ..$ model :'data.frame': 12 obs. of 2 variables: ## .. ..$ percent: num [1:12] 0.0279 0.0273 0.0272 0.0276 0.0276 ... ## .. ..$ pce : num [1:12] 5086 5133 5173 5208 5224 ... ## .. ..- attr(*, "terms")=Classes 'terms', 'formula' language percent ~ pce ## .. .. .. ..- attr(*, "variables")= language list(percent, pce) ## .. .. .. ..- attr(*, "factors")= int [1:2, 1] 0 1 ## .. .. .. .. ..- attr(*, "dimnames")=List of 2 ## .. .. .. .. .. ..$ : chr [1:2] "percent" "pce" ## .. .. .. .. .. ..$ : chr "pce" ## .. .. .. ..- attr(*, "term.labels")= chr "pce" ## .. .. .. ..- attr(*, "order")= int 1 ## .. .. .. ..- attr(*, "intercept")= int 1 ## .. .. .. ..- attr(*, "response")= int 1 ## .. .. .. ..- attr(*, ".Environment")=<environment: 0x7f8013205580> ## .. .. .. ..- attr(*, "predvars")= language list(percent, pce) ## .. .. .. ..- attr(*, "dataClasses")= Named chr [1:2] "numeric" "numeric" ## .. .. .. .. ..- attr(*, "names")= chr [1:2] "percent" "pce" ## ..- attr(*, "class")= chr "lm" ## $ 1997:List of 12 ## ..$ coefficients : Named num [1:2] 7.97e-02 -9.94e-06 ## .. ..- attr(*, "names")= chr [1:2] "(Intercept)" "pce" ## ..$ residuals : Named num [1:12] 0.000463 0.000462 0.000265 -0.000176 -0.000991 ... ## .. ..- attr(*, "names")= chr [1:12] "1" "2" "3" "4" ... ## ..$ effects : Named num [1:12] -0.085448 -0.003197 0.000112 -0.000324 -0.001139 ... ## .. ..- attr(*, "names")= chr [1:12] "(Intercept)" "pce" "" "" ... ## ..$ rank : int 2 ## ..$ fitted.values: Named num [1:12] 0.0259 0.0257 0.0255 0.0254 0.0254 ... ## .. ..- attr(*, "names")= chr [1:12] "1" "2" "3" "4" ... ## ..$ assign : int [1:2] 0 1 ## ..$ qr :List of 5 ## .. ..$ qr : num [1:12, 1:2] -3.464 0.289 0.289 0.289 0.289 ... ## .. .. ..- attr(*, "dimnames")=List of 2 ## .. .. .. ..$ : chr [1:12] "1" "2" "3" "4" ... ## .. .. .. ..$ : chr [1:2] "(Intercept)" "pce" ## .. .. ..- attr(*, "assign")= int [1:2] 0 1 ## .. ..$ qraux: num [1:2] 1.29 1.23 ## .. ..$ pivot: int [1:2] 1 2 ## .. ..$ tol : num 1e-07 ## .. ..$ rank : int 2 ## .. ..- attr(*, "class")= chr "qr" ## ..$ df.residual : int 10 ## ..$ xlevels : Named list() ## ..$ call : language lm(formula = percent ~ pce, data = .x) ## ..$ terms :Classes 'terms', 'formula' language percent ~ pce ## .. .. ..- attr(*, "variables")= language list(percent, pce) ## .. .. ..- attr(*, "factors")= int [1:2, 1] 0 1 ## .. .. .. ..- attr(*, "dimnames")=List of 2 ## .. .. .. .. ..$ : chr [1:2] "percent" "pce" ## .. .. .. .. ..$ : chr "pce" ## .. .. ..- attr(*, "term.labels")= chr "pce" ## .. .. ..- attr(*, "order")= int 1 ## .. .. ..- attr(*, "intercept")= int 1 ## .. .. ..- attr(*, "response")= int 1 ## .. .. ..- attr(*, ".Environment")=<environment: 0x7f8013270680> ## .. .. ..- attr(*, "predvars")= language list(percent, pce) ## .. .. ..- attr(*, "dataClasses")= Named chr [1:2] "numeric" "numeric" ## .. .. .. ..- attr(*, "names")= chr [1:2] "percent" "pce" ## ..$ model :'data.frame': 12 obs. of 2 variables: ## .. ..$ percent: num [1:12] 0.0264 0.0262 0.0258 0.0253 0.0244 ... ## .. ..$ pce : num [1:12] 5411 5434 5454 5459 5460 ... ## .. ..- attr(*, "terms")=Classes 'terms', 'formula' language percent ~ pce ## .. .. .. ..- attr(*, "variables")= language list(percent, pce) ## .. .. .. ..- attr(*, "factors")= int [1:2, 1] 0 1 ## .. .. .. .. ..- attr(*, "dimnames")=List of 2 ## .. .. .. .. .. ..$ : chr [1:2] "percent" "pce" ## .. .. .. .. .. ..$ : chr "pce" ## .. .. .. ..- attr(*, "term.labels")= chr "pce" ## .. .. .. ..- attr(*, "order")= int 1 ## .. .. .. ..- attr(*, "intercept")= int 1 ## .. .. .. ..- attr(*, "response")= int 1 ## .. .. .. ..- attr(*, ".Environment")=<environment: 0x7f8013270680> ## .. .. .. ..- attr(*, "predvars")= language list(percent, pce) ## .. .. .. ..- attr(*, "dataClasses")= Named chr [1:2] "numeric" "numeric" ## .. .. .. .. ..- attr(*, "names")= chr [1:2] "percent" "pce" ## ..- attr(*, "class")= chr "lm" ## $ 1998:List of 12 ## ..$ coefficients : Named num [1:2] 3.59e-02 -2.28e-06 ## .. ..- attr(*, "names")= chr [1:2] "(Intercept)" "pce" ## ..$ residuals : Named num [1:12] 0.000283 0.000117 0.000582 -0.0011 -0.000622 ... ## .. ..- attr(*, "names")= chr [1:12] "1" "2" "3" "4" ... ## ..$ effects : Named num [1:12] -0.077862 -0.00093 0.00051 -0.001169 -0.000686 ... ## .. ..- attr(*, "names")= chr [1:12] "(Intercept)" "pce" "" "" ... ## ..$ rank : int 2 ## ..$ fitted.values: Named num [1:12] 0.0229 0.0228 0.0228 0.0227 0.0226 ... ## .. ..- attr(*, "names")= chr [1:12] "1" "2" "3" "4" ... ## ..$ assign : int [1:2] 0 1 ## ..$ qr :List of 5 ## .. ..$ qr : num [1:12, 1:2] -3.464 0.289 0.289 0.289 0.289 ... ## .. .. ..- attr(*, "dimnames")=List of 2 ## .. .. .. ..$ : chr [1:12] "1" "2" "3" "4" ... ## .. .. .. ..$ : chr [1:2] "(Intercept)" "pce" ## .. .. ..- attr(*, "assign")= int [1:2] 0 1 ## .. ..$ qraux: num [1:2] 1.29 1.27 ## .. ..$ pivot: int [1:2] 1 2 ## .. ..$ tol : num 1e-07 ## .. ..$ rank : int 2 ## .. ..- attr(*, "class")= chr "qr" ## ..$ df.residual : int 10 ## ..$ xlevels : Named list() ## ..$ call : language lm(formula = percent ~ pce, data = .x) ## ..$ terms :Classes 'terms', 'formula' language percent ~ pce ## .. .. ..- attr(*, "variables")= language list(percent, pce) ## .. .. ..- attr(*, "factors")= int [1:2, 1] 0 1 ## .. .. .. ..- attr(*, "dimnames")=List of 2 ## .. .. .. .. ..$ : chr [1:2] "percent" "pce" ## .. .. .. .. ..$ : chr "pce" ## .. .. ..- attr(*, "term.labels")= chr "pce" ## .. .. ..- attr(*, "order")= int 1 ## .. .. ..- attr(*, "intercept")= int 1 ## .. .. ..- attr(*, "response")= int 1 ## .. .. ..- attr(*, ".Environment")=<environment: 0x7f8012bfe7e8> ## .. .. ..- attr(*, "predvars")= language list(percent, pce) ## .. .. ..- attr(*, "dataClasses")= Named chr [1:2] "numeric" "numeric" ## .. .. .. ..- attr(*, "names")= chr [1:2] "percent" "pce" ## ..$ model :'data.frame': 12 obs. of 2 variables: ## .. ..$ percent: num [1:12] 0.0232 0.0229 0.0233 0.0216 0.0219 ... ## .. ..$ pce : num [1:12] 5690 5724 5750 5788 5838 ... ## .. ..- attr(*, "terms")=Classes 'terms', 'formula' language percent ~ pce ## .. .. .. ..- attr(*, "variables")= language list(percent, pce) ## .. .. .. ..- attr(*, "factors")= int [1:2, 1] 0 1 ## .. .. .. .. ..- attr(*, "dimnames")=List of 2 ## .. .. .. .. .. ..$ : chr [1:2] "percent" "pce" ## .. .. .. .. .. ..$ : chr "pce" ## .. .. .. ..- attr(*, "term.labels")= chr "pce" ## .. .. .. ..- attr(*, "order")= int 1 ## .. .. .. ..- attr(*, "intercept")= int 1 ## .. .. .. ..- attr(*, "response")= int 1 ## .. .. .. ..- attr(*, ".Environment")=<environment: 0x7f8012bfe7e8> ## .. .. .. ..- attr(*, "predvars")= language list(percent, pce) ## .. .. .. ..- attr(*, "dataClasses")= Named chr [1:2] "numeric" "numeric" ## .. .. .. .. ..- attr(*, "names")= chr [1:2] "percent" "pce" ## ..- attr(*, "class")= chr "lm" ## $ 1999:List of 12 ## ..$ coefficients : Named num [1:2] 3.92e-02 -2.89e-06 ## .. ..- attr(*, "names")= chr [1:2] "(Intercept)" "pce" ## ..$ residuals : Named num [1:12] -0.000142 0.000412 -0.000693 0.000265 -0.000417 ... ## .. ..- attr(*, "names")= chr [1:12] "1" "2" "3" "4" ... ## ..$ effects : Named num [1:12] -0.072946 -0.001374 -0.000735 0.000269 -0.00039 ... ## .. ..- attr(*, "names")= chr [1:12] "(Intercept)" "pce" "" "" ... ## ..$ rank : int 2 ## ..$ fitted.values: Named num [1:12] 0.0217 0.0216 0.0215 0.0213 0.0212 ... ## .. ..- attr(*, "names")= chr [1:12] "1" "2" "3" "4" ... ## ..$ assign : int [1:2] 0 1 ## ..$ qr :List of 5 ## .. ..$ qr : num [1:12, 1:2] -3.464 0.289 0.289 0.289 0.289 ... ## .. .. ..- attr(*, "dimnames")=List of 2 ## .. .. .. ..$ : chr [1:12] "1" "2" "3" "4" ... ## .. .. .. ..$ : chr [1:2] "(Intercept)" "pce" ## .. .. ..- attr(*, "assign")= int [1:2] 0 1 ## .. ..$ qraux: num [1:2] 1.29 1.28 ## .. ..$ pivot: int [1:2] 1 2 ## .. ..$ tol : num 1e-07 ## .. ..$ rank : int 2 ## .. ..- attr(*, "class")= chr "qr" ## ..$ df.residual : int 10 ## ..$ xlevels : Named list() ## ..$ call : language lm(formula = percent ~ pce, data = .x) ## ..$ terms :Classes 'terms', 'formula' language percent ~ pce ## .. .. ..- attr(*, "variables")= language list(percent, pce) ## .. .. ..- attr(*, "factors")= int [1:2, 1] 0 1 ## .. .. .. ..- attr(*, "dimnames")=List of 2 ## .. .. .. .. ..$ : chr [1:2] "percent" "pce" ## .. .. .. .. ..$ : chr "pce" ## .. .. ..- attr(*, "term.labels")= chr "pce" ## .. .. ..- attr(*, "order")= int 1 ## .. .. ..- attr(*, "intercept")= int 1 ## .. .. ..- attr(*, "response")= int 1 ## .. .. ..- attr(*, ".Environment")=<environment: 0x7f8012c97938> ## .. .. ..- attr(*, "predvars")= language list(percent, pce) ## .. .. ..- attr(*, "dataClasses")= Named chr [1:2] "numeric" "numeric" ## .. .. .. ..- attr(*, "names")= chr [1:2] "percent" "pce" ## ..$ model :'data.frame': 12 obs. of 2 variables: ## .. ..$ percent: num [1:12] 0.0215 0.022 0.0208 0.0216 0.0208 ... ## .. ..$ pce : num [1:12] 6073 6102 6133 6196 6226 ... ## .. ..- attr(*, "terms")=Classes 'terms', 'formula' language percent ~ pce ## .. .. .. ..- attr(*, "variables")= language list(percent, pce) ## .. .. .. ..- attr(*, "factors")= int [1:2, 1] 0 1 ## .. .. .. .. ..- attr(*, "dimnames")=List of 2 ## .. .. .. .. .. ..$ : chr [1:2] "percent" "pce" ## .. .. .. .. .. ..$ : chr "pce" ## .. .. .. ..- attr(*, "term.labels")= chr "pce" ## .. .. .. ..- attr(*, "order")= int 1 ## .. .. .. ..- attr(*, "intercept")= int 1 ## .. .. .. ..- attr(*, "response")= int 1 ## .. .. .. ..- attr(*, ".Environment")=<environment: 0x7f8012c97938> ## .. .. .. ..- attr(*, "predvars")= language list(percent, pce) ## .. .. .. ..- attr(*, "dataClasses")= Named chr [1:2] "numeric" "numeric" ## .. .. .. .. ..- attr(*, "names")= chr [1:2] "percent" "pce" ## ..- attr(*, "class")= chr "lm" ## $ 2000:List of 12 ## ..$ coefficients : Named num [1:2] 3.1e-02 -1.6e-06 ## .. ..- attr(*, "names")= chr [1:2] "(Intercept)" "pce" ## ..$ residuals : Named num [1:12] -0.000188 0.000465 0.000111 -0.000825 0.000201 ... ## .. ..- attr(*, "names")= chr [1:12] "1" "2" "3" "4" ... ## ..$ effects : Named num [1:12] -0.069765 -0.000669 0.000127 -0.000823 0.000239 ... ## .. ..- attr(*, "names")= chr [1:12] "(Intercept)" "pce" "" "" ... ## ..$ rank : int 2 ## ..$ fitted.values: Named num [1:12] 0.0205 0.0204 0.0203 0.0203 0.0202 ... ## .. ..- attr(*, "names")= chr [1:12] "1" "2" "3" "4" ... ## ..$ assign : int [1:2] 0 1 ## ..$ qr :List of 5 ## .. ..$ qr : num [1:12, 1:2] -3.464 0.289 0.289 0.289 0.289 ... ## .. .. ..- attr(*, "dimnames")=List of 2 ## .. .. .. ..$ : chr [1:12] "1" "2" "3" "4" ... ## .. .. .. ..$ : chr [1:2] "(Intercept)" "pce" ## .. .. ..- attr(*, "assign")= int [1:2] 0 1 ## .. ..$ qraux: num [1:2] 1.29 1.22 ## .. ..$ pivot: int [1:2] 1 2 ## .. ..$ tol : num 1e-07 ## .. ..$ rank : int 2 ## .. ..- attr(*, "class")= chr "qr" ## ..$ df.residual : int 10 ## ..$ xlevels : Named list() ## ..$ call : language lm(formula = percent ~ pce, data = .x) ## ..$ terms :Classes 'terms', 'formula' language percent ~ pce ## .. .. ..- attr(*, "variables")= language list(percent, pce) ## .. .. ..- attr(*, "factors")= int [1:2, 1] 0 1 ## .. .. .. ..- attr(*, "dimnames")=List of 2 ## .. .. .. .. ..$ : chr [1:2] "percent" "pce" ## .. .. .. .. ..$ : chr "pce" ## .. .. ..- attr(*, "term.labels")= chr "pce" ## .. .. ..- attr(*, "order")= int 1 ## .. .. ..- attr(*, "intercept")= int 1 ## .. .. ..- attr(*, "response")= int 1 ## .. .. ..- attr(*, ".Environment")=<environment: 0x7f800373c618> ## .. .. ..- attr(*, "predvars")= language list(percent, pce) ## .. .. ..- attr(*, "dataClasses")= Named chr [1:2] "numeric" "numeric" ## .. .. .. ..- attr(*, "names")= chr [1:2] "percent" "pce" ## ..$ model :'data.frame': 12 obs. of 2 variables: ## .. ..$ percent: num [1:12] 0.0203 0.0208 0.0204 0.0195 0.0204 ... ## .. ..$ pce : num [1:12] 6535 6620 6686 6671 6708 ... ## .. ..- attr(*, "terms")=Classes 'terms', 'formula' language percent ~ pce ## .. .. .. ..- attr(*, "variables")= language list(percent, pce) ## .. .. .. ..- attr(*, "factors")= int [1:2, 1] 0 1 ## .. .. .. .. ..- attr(*, "dimnames")=List of 2 ## .. .. .. .. .. ..$ : chr [1:2] "percent" "pce" ## .. .. .. .. .. ..$ : chr "pce" ## .. .. .. ..- attr(*, "term.labels")= chr "pce" ## .. .. .. ..- attr(*, "order")= int 1 ## .. .. .. ..- attr(*, "intercept")= int 1 ## .. .. .. ..- attr(*, "response")= int 1 ## .. .. .. ..- attr(*, ".Environment")=<environment: 0x7f800373c618> ## .. .. .. ..- attr(*, "predvars")= language list(percent, pce) ## .. .. .. ..- attr(*, "dataClasses")= Named chr [1:2] "numeric" "numeric" ## .. .. .. .. ..- attr(*, "names")= chr [1:2] "percent" "pce" ## ..- attr(*, "class")= chr "lm" ## $ 2001:List of 12 ## ..$ coefficients : Named num [1:2] -0.18813 0.00003 ## .. ..- attr(*, "names")= chr [1:2] "(Intercept)" "pce" ## ..$ residuals : Named num [1:12] -6.43e-05 -4.13e-04 -8.60e-06 3.15e-05 -1.52e-03 ... ## .. ..- attr(*, "names")= chr [1:12] "1" "2" "3" "4" ... ## ..$ effects : Named num [1:12] -8.29e-02 7.69e-03 8.11e-05 1.04e-04 -1.51e-03 ... ## .. ..- attr(*, "names")= chr [1:12] "(Intercept)" "pce" "" "" ... ## ..$ rank : int 2 ## ..$ fitted.values: Named num [1:12] 0.0213 0.0218 0.0216 0.022 0.0234 ... ## .. ..- attr(*, "names")= chr [1:12] "1" "2" "3" "4" ... ## ..$ assign : int [1:2] 0 1 ## ..$ qr :List of 5 ## .. ..$ qr : num [1:12, 1:2] -3.464 0.289 0.289 0.289 0.289 ... ## .. .. ..- attr(*, "dimnames")=List of 2 ## .. .. .. ..$ : chr [1:12] "1" "2" "3" "4" ... ## .. .. .. ..$ : chr [1:2] "(Intercept)" "pce" ## .. .. ..- attr(*, "assign")= int [1:2] 0 1 ## .. ..$ qraux: num [1:2] 1.29 1.2 ## .. ..$ pivot: int [1:2] 1 2 ## .. ..$ tol : num 1e-07 ## .. ..$ rank : int 2 ## .. ..- attr(*, "class")= chr "qr" ## ..$ df.residual : int 10 ## ..$ xlevels : Named list() ## ..$ call : language lm(formula = percent ~ pce, data = .x) ## ..$ terms :Classes 'terms', 'formula' language percent ~ pce ## .. .. ..- attr(*, "variables")= language list(percent, pce) ## .. .. ..- attr(*, "factors")= int [1:2, 1] 0 1 ## .. .. .. ..- attr(*, "dimnames")=List of 2 ## .. .. .. .. ..$ : chr [1:2] "percent" "pce" ## .. .. .. .. ..$ : chr "pce" ## .. .. ..- attr(*, "term.labels")= chr "pce" ## .. .. ..- attr(*, "order")= int 1 ## .. .. ..- attr(*, "intercept")= int 1 ## .. .. ..- attr(*, "response")= int 1 ## .. .. ..- attr(*, ".Environment")=<environment: 0x7f8012d19b58> ## .. .. ..- attr(*, "predvars")= language list(percent, pce) ## .. .. ..- attr(*, "dataClasses")= Named chr [1:2] "numeric" "numeric" ## .. .. .. ..- attr(*, "names")= chr [1:2] "percent" "pce" ## ..$ model :'data.frame': 12 obs. of 2 variables: ## .. ..$ percent: num [1:12] 0.0212 0.0214 0.0216 0.022 0.0219 ... ## .. ..$ pce : num [1:12] 6977 6996 6988 7001 7047 ... ## .. ..- attr(*, "terms")=Classes 'terms', 'formula' language percent ~ pce ## .. .. .. ..- attr(*, "variables")= language list(percent, pce) ## .. .. .. ..- attr(*, "factors")= int [1:2, 1] 0 1 ## .. .. .. .. ..- attr(*, "dimnames")=List of 2 ## .. .. .. .. .. ..$ : chr [1:2] "percent" "pce" ## .. .. .. .. .. ..$ : chr "pce" ## .. .. .. ..- attr(*, "term.labels")= chr "pce" ## .. .. .. ..- attr(*, "order")= int 1 ## .. .. .. ..- attr(*, "intercept")= int 1 ## .. .. .. ..- attr(*, "response")= int 1 ## .. .. .. ..- attr(*, ".Environment")=<environment: 0x7f8012d19b58> ## .. .. .. ..- attr(*, "predvars")= language list(percent, pce) ## .. .. .. ..- attr(*, "dataClasses")= Named chr [1:2] "numeric" "numeric" ## .. .. .. .. ..- attr(*, "names")= chr [1:2] "percent" "pce" ## ..- attr(*, "class")= chr "lm" ## $ 2002:List of 12 ## ..$ coefficients : Named num [1:2] 1.43e-02 2.01e-06 ## .. ..- attr(*, "names")= chr [1:2] "(Intercept)" "pce" ## ..$ residuals : Named num [1:12] -2.10e-04 -2.04e-04 4.85e-05 9.17e-04 2.44e-04 ... ## .. ..- attr(*, "names")= chr [1:12] "1" "2" "3" "4" ... ## ..$ effects : Named num [1:12] -0.100731 0.000692 0.00012 0.000964 0.000299 ... ## .. ..- attr(*, "names")= chr [1:12] "(Intercept)" "pce" "" "" ... ## ..$ rank : int 2 ## ..$ fitted.values: Named num [1:12] 0.0287 0.0288 0.0289 0.029 0.029 ... ## .. ..- attr(*, "names")= chr [1:12] "1" "2" "3" "4" ... ## ..$ assign : int [1:2] 0 1 ## ..$ qr :List of 5 ## .. ..$ qr : num [1:12, 1:2] -3.464 0.289 0.289 0.289 0.289 ... ## .. .. ..- attr(*, "dimnames")=List of 2 ## .. .. .. ..$ : chr [1:12] "1" "2" "3" "4" ... ## .. .. .. ..$ : chr [1:2] "(Intercept)" "pce" ## .. .. ..- attr(*, "assign")= int [1:2] 0 1 ## .. ..$ qraux: num [1:2] 1.29 1.25 ## .. ..$ pivot: int [1:2] 1 2 ## .. ..$ tol : num 1e-07 ## .. ..$ rank : int 2 ## .. ..- attr(*, "class")= chr "qr" ## ..$ df.residual : int 10 ## ..$ xlevels : Named list() ## ..$ call : language lm(formula = percent ~ pce, data = .x) ## ..$ terms :Classes 'terms', 'formula' language percent ~ pce ## .. .. ..- attr(*, "variables")= language list(percent, pce) ## .. .. ..- attr(*, "factors")= int [1:2, 1] 0 1 ## .. .. .. ..- attr(*, "dimnames")=List of 2 ## .. .. .. .. ..$ : chr [1:2] "percent" "pce" ## .. .. .. .. ..$ : chr "pce" ## .. .. ..- attr(*, "term.labels")= chr "pce" ## .. .. ..- attr(*, "order")= int 1 ## .. .. ..- attr(*, "intercept")= int 1 ## .. .. ..- attr(*, "response")= int 1 ## .. .. ..- attr(*, ".Environment")=<environment: 0x7f8012d57580> ## .. .. ..- attr(*, "predvars")= language list(percent, pce) ## .. .. ..- attr(*, "dataClasses")= Named chr [1:2] "numeric" "numeric" ## .. .. .. ..- attr(*, "names")= chr [1:2] "percent" "pce" ## ..$ model :'data.frame': 12 obs. of 2 variables: ## .. ..$ percent: num [1:12] 0.0285 0.0286 0.0289 0.0299 0.0292 ... ## .. ..$ pce : num [1:12] 7174 7218 7237 7305 7283 ... ## .. ..- attr(*, "terms")=Classes 'terms', 'formula' language percent ~ pce ## .. .. .. ..- attr(*, "variables")= language list(percent, pce) ## .. .. .. ..- attr(*, "factors")= int [1:2, 1] 0 1 ## .. .. .. .. ..- attr(*, "dimnames")=List of 2 ## .. .. .. .. .. ..$ : chr [1:2] "percent" "pce" ## .. .. .. .. .. ..$ : chr "pce" ## .. .. .. ..- attr(*, "term.labels")= chr "pce" ## .. .. .. ..- attr(*, "order")= int 1 ## .. .. .. ..- attr(*, "intercept")= int 1 ## .. .. .. ..- attr(*, "response")= int 1 ## .. .. .. ..- attr(*, ".Environment")=<environment: 0x7f8012d57580> ## .. .. .. ..- attr(*, "predvars")= language list(percent, pce) ## .. .. .. ..- attr(*, "dataClasses")= Named chr [1:2] "numeric" "numeric" ## .. .. .. .. ..- attr(*, "names")= chr [1:2] "percent" "pce" ## ..- attr(*, "class")= chr "lm" ## $ 2003:List of 12 ## ..$ coefficients : Named num [1:2] 4.03e-02 -1.31e-06 ## .. ..- attr(*, "names")= chr [1:2] "(Intercept)" "pce" ## ..$ residuals : Named num [1:12] -0.000987 -0.000665 -0.000707 0.000176 0.000559 ... ## .. ..- attr(*, "names")= chr [1:12] "1" "2" "3" "4" ... ## ..$ effects : Named num [1:12] -0.104501 -0.000616 -0.000427 0.00044 0.000817 ... ## .. ..- attr(*, "names")= chr [1:12] "(Intercept)" "pce" "" "" ... ## ..$ rank : int 2 ## ..$ fitted.values: Named num [1:12] 0.0304 0.0304 0.0303 0.0303 0.0303 ... ## .. ..- attr(*, "names")= chr [1:12] "1" "2" "3" "4" ... ## ..$ assign : int [1:2] 0 1 ## ..$ qr :List of 5 ## .. ..$ qr : num [1:12, 1:2] -3.464 0.289 0.289 0.289 0.289 ... ## .. .. ..- attr(*, "dimnames")=List of 2 ## .. .. .. ..$ : chr [1:12] "1" "2" "3" "4" ... ## .. .. .. ..$ : chr [1:2] "(Intercept)" "pce" ## .. .. ..- attr(*, "assign")= int [1:2] 0 1 ## .. ..$ qraux: num [1:2] 1.29 1.31 ## .. ..$ pivot: int [1:2] 1 2 ## .. ..$ tol : num 1e-07 ## .. ..$ rank : int 2 ## .. ..- attr(*, "class")= chr "qr" ## ..$ df.residual : int 10 ## ..$ xlevels : Named list() ## ..$ call : language lm(formula = percent ~ pce, data = .x) ## ..$ terms :Classes 'terms', 'formula' language percent ~ pce ## .. .. ..- attr(*, "variables")= language list(percent, pce) ## .. .. ..- attr(*, "factors")= int [1:2, 1] 0 1 ## .. .. .. ..- attr(*, "dimnames")=List of 2 ## .. .. .. .. ..$ : chr [1:2] "percent" "pce" ## .. .. .. .. ..$ : chr "pce" ## .. .. ..- attr(*, "term.labels")= chr "pce" ## .. .. ..- attr(*, "order")= int 1 ## .. .. ..- attr(*, "intercept")= int 1 ## .. .. ..- attr(*, "response")= int 1 ## .. .. ..- attr(*, ".Environment")=<environment: 0x7f80100d3a38> ## .. .. ..- attr(*, "predvars")= language list(percent, pce) ## .. .. ..- attr(*, "dataClasses")= Named chr [1:2] "numeric" "numeric" ## .. .. .. ..- attr(*, "names")= chr [1:2] "percent" "pce" ## ..$ model :'data.frame': 12 obs. of 2 variables: ## .. ..$ percent: num [1:12] 0.0294 0.0297 0.0296 0.0305 0.0308 ... ## .. ..$ pce : num [1:12] 7533 7536 7598 7621 7628 ... ## .. ..- attr(*, "terms")=Classes 'terms', 'formula' language percent ~ pce ## .. .. .. ..- attr(*, "variables")= language list(percent, pce) ## .. .. .. ..- attr(*, "factors")= int [1:2, 1] 0 1 ## .. .. .. .. ..- attr(*, "dimnames")=List of 2 ## .. .. .. .. .. ..$ : chr [1:2] "percent" "pce" ## .. .. .. .. .. ..$ : chr "pce" ## .. .. .. ..- attr(*, "term.labels")= chr "pce" ## .. .. .. ..- attr(*, "order")= int 1 ## .. .. .. ..- attr(*, "intercept")= int 1 ## .. .. .. ..- attr(*, "response")= int 1 ## .. .. .. ..- attr(*, ".Environment")=<environment: 0x7f80100d3a38> ## .. .. .. ..- attr(*, "predvars")= language list(percent, pce) ## .. .. .. ..- attr(*, "dataClasses")= Named chr [1:2] "numeric" "numeric" ## .. .. .. .. ..- attr(*, "names")= chr [1:2] "percent" "pce" ## ..- attr(*, "class")= chr "lm" ## $ 2004:List of 12 ## ..$ coefficients : Named num [1:2] 5.76e-02 -3.64e-06 ## .. ..- attr(*, "names")= chr [1:2] "(Intercept)" "pce" ## ..$ residuals : Named num [1:12] 8.04e-05 -5.13e-04 7.80e-04 -2.92e-04 1.02e-04 ... ## .. ..- attr(*, "names")= chr [1:12] "1" "2" "3" "4" ... ## ..$ effects : Named num [1:12] -9.61e-02 -1.94e-03 8.30e-04 -2.52e-04 8.35e-05 ... ## .. ..- attr(*, "names")= chr [1:12] "(Intercept)" "pce" "" "" ... ## ..$ rank : int 2 ## ..$ fitted.values: Named num [1:12] 0.0286 0.0284 0.0282 0.0282 0.0279 ... ## .. ..- attr(*, "names")= chr [1:12] "1" "2" "3" "4" ... ## ..$ assign : int [1:2] 0 1 ## ..$ qr :List of 5 ## .. ..$ qr : num [1:12, 1:2] -3.464 0.289 0.289 0.289 0.289 ... ## .. .. ..- attr(*, "dimnames")=List of 2 ## .. .. .. ..$ : chr [1:12] "1" "2" "3" "4" ... ## .. .. .. ..$ : chr [1:2] "(Intercept)" "pce" ## .. .. ..- attr(*, "assign")= int [1:2] 0 1 ## .. ..$ qraux: num [1:2] 1.29 1.27 ## .. ..$ pivot: int [1:2] 1 2 ## .. ..$ tol : num 1e-07 ## .. ..$ rank : int 2 ## .. ..- attr(*, "class")= chr "qr" ## ..$ df.residual : int 10 ## ..$ xlevels : Named list() ## ..$ call : language lm(formula = percent ~ pce, data = .x) ## ..$ terms :Classes 'terms', 'formula' language percent ~ pce ## .. .. ..- attr(*, "variables")= language list(percent, pce) ## .. .. ..- attr(*, "factors")= int [1:2, 1] 0 1 ## .. .. .. ..- attr(*, "dimnames")=List of 2 ## .. .. .. .. ..$ : chr [1:2] "percent" "pce" ## .. .. .. .. ..$ : chr "pce" ## .. .. ..- attr(*, "term.labels")= chr "pce" ## .. .. ..- attr(*, "order")= int 1 ## .. .. ..- attr(*, "intercept")= int 1 ## .. .. ..- attr(*, "response")= int 1 ## .. .. ..- attr(*, ".Environment")=<environment: 0x7f8010363180> ## .. .. ..- attr(*, "predvars")= language list(percent, pce) ## .. .. ..- attr(*, "dataClasses")= Named chr [1:2] "numeric" "numeric" ## .. .. .. ..- attr(*, "names")= chr [1:2] "percent" "pce" ## ..$ model :'data.frame': 12 obs. of 2 variables: ## .. ..$ percent: num [1:12] 0.0286 0.0279 0.029 0.0279 0.028 ... ## .. ..$ pce : num [1:12] 7987 8020 8076 8089 8163 ... ## .. ..- attr(*, "terms")=Classes 'terms', 'formula' language percent ~ pce ## .. .. .. ..- attr(*, "variables")= language list(percent, pce) ## .. .. .. ..- attr(*, "factors")= int [1:2, 1] 0 1 ## .. .. .. .. ..- attr(*, "dimnames")=List of 2 ## .. .. .. .. .. ..$ : chr [1:2] "percent" "pce" ## .. .. .. .. .. ..$ : chr "pce" ## .. .. .. ..- attr(*, "term.labels")= chr "pce" ## .. .. .. ..- attr(*, "order")= int 1 ## .. .. .. ..- attr(*, "intercept")= int 1 ## .. .. .. ..- attr(*, "response")= int 1 ## .. .. .. ..- attr(*, ".Environment")=<environment: 0x7f8010363180> ## .. .. .. ..- attr(*, "predvars")= language list(percent, pce) ## .. .. .. ..- attr(*, "dataClasses")= Named chr [1:2] "numeric" "numeric" ## .. .. .. .. ..- attr(*, "names")= chr [1:2] "percent" "pce" ## ..- attr(*, "class")= chr "lm" ## $ 2005:List of 12 ## ..$ coefficients : Named num [1:2] 5.78e-02 -3.68e-06 ## .. ..- attr(*, "names")= chr [1:2] "(Intercept)" "pce" ## ..$ residuals : Named num [1:12] -2.22e-04 6.42e-04 -4.89e-05 -6.86e-06 -1.03e-04 ... ## .. ..- attr(*, "names")= chr [1:12] "1" "2" "3" "4" ... ## ..$ effects : Named num [1:12] -8.87e-02 -2.11e-03 -1.09e-04 5.32e-06 -9.24e-05 ... ## .. ..- attr(*, "names")= chr [1:12] "(Intercept)" "pce" "" "" ... ## ..$ rank : int 2 ## ..$ fitted.values: Named num [1:12] 0.0266 0.0264 0.0263 0.026 0.026 ... ## .. ..- attr(*, "names")= chr [1:12] "1" "2" "3" "4" ... ## ..$ assign : int [1:2] 0 1 ## ..$ qr :List of 5 ## .. ..$ qr : num [1:12, 1:2] -3.464 0.289 0.289 0.289 0.289 ... ## .. .. ..- attr(*, "dimnames")=List of 2 ## .. .. .. ..$ : chr [1:12] "1" "2" "3" "4" ... ## .. .. .. ..$ : chr [1:2] "(Intercept)" "pce" ## .. .. ..- attr(*, "assign")= int [1:2] 0 1 ## .. ..$ qraux: num [1:2] 1.29 1.27 ## .. ..$ pivot: int [1:2] 1 2 ## .. ..$ tol : num 1e-07 ## .. ..$ rank : int 2 ## .. ..- attr(*, "class")= chr "qr" ## ..$ df.residual : int 10 ## ..$ xlevels : Named list() ## ..$ call : language lm(formula = percent ~ pce, data = .x) ## ..$ terms :Classes 'terms', 'formula' language percent ~ pce ## .. .. ..- attr(*, "variables")= language list(percent, pce) ## .. .. ..- attr(*, "factors")= int [1:2, 1] 0 1 ## .. .. .. ..- attr(*, "dimnames")=List of 2 ## .. .. .. .. ..$ : chr [1:2] "percent" "pce" ## .. .. .. .. ..$ : chr "pce" ## .. .. ..- attr(*, "term.labels")= chr "pce" ## .. .. ..- attr(*, "order")= int 1 ## .. .. ..- attr(*, "intercept")= int 1 ## .. .. ..- attr(*, "response")= int 1 ## .. .. ..- attr(*, ".Environment")=<environment: 0x7f80103ede30> ## .. .. ..- attr(*, "predvars")= language list(percent, pce) ## .. .. ..- attr(*, "dataClasses")= Named chr [1:2] "numeric" "numeric" ## .. .. .. ..- attr(*, "names")= chr [1:2] "percent" "pce" ## ..$ model :'data.frame': 12 obs. of 2 variables: ## .. ..$ percent: num [1:12] 0.0264 0.027 0.0262 0.026 0.0259 ... ## .. ..$ pce : num [1:12] 8470 8529 8570 8646 8644 ... ## .. ..- attr(*, "terms")=Classes 'terms', 'formula' language percent ~ pce ## .. .. .. ..- attr(*, "variables")= language list(percent, pce) ## .. .. .. ..- attr(*, "factors")= int [1:2, 1] 0 1 ## .. .. .. .. ..- attr(*, "dimnames")=List of 2 ## .. .. .. .. .. ..$ : chr [1:2] "percent" "pce" ## .. .. .. .. .. ..$ : chr "pce" ## .. .. .. ..- attr(*, "term.labels")= chr "pce" ## .. .. .. ..- attr(*, "order")= int 1 ## .. .. .. ..- attr(*, "intercept")= int 1 ## .. .. .. ..- attr(*, "response")= int 1 ## .. .. .. ..- attr(*, ".Environment")=<environment: 0x7f80103ede30> ## .. .. .. ..- attr(*, "predvars")= language list(percent, pce) ## .. .. .. ..- attr(*, "dataClasses")= Named chr [1:2] "numeric" "numeric" ## .. .. .. .. ..- attr(*, "names")= chr [1:2] "percent" "pce" ## ..- attr(*, "class")= chr "lm" ## $ 2006:List of 12 ## ..$ coefficients : Named num [1:2] 5.46e-02 -3.37e-06 ## .. ..- attr(*, "names")= chr [1:2] "(Intercept)" "pce" ## ..$ residuals : Named num [1:12] -0.000332 0.000157 -0.000128 0.000193 -0.000157 ... ## .. ..- attr(*, "names")= chr [1:12] "1" "2" "3" "4" ... ## ..$ effects : Named num [1:12] -8.10e-02 -1.45e-03 -9.23e-05 2.50e-04 -8.33e-05 ... ## .. ..- attr(*, "names")= chr [1:12] "(Intercept)" "pce" "" "" ... ## ..$ rank : int 2 ## ..$ fitted.values: Named num [1:12] 0.0241 0.024 0.0239 0.0237 0.0235 ... ## .. ..- attr(*, "names")= chr [1:12] "1" "2" "3" "4" ... ## ..$ assign : int [1:2] 0 1 ## ..$ qr :List of 5 ## .. ..$ qr : num [1:12, 1:2] -3.464 0.289 0.289 0.289 0.289 ... ## .. .. ..- attr(*, "dimnames")=List of 2 ## .. .. .. ..$ : chr [1:12] "1" "2" "3" "4" ... ## .. .. .. ..$ : chr [1:2] "(Intercept)" "pce" ## .. .. ..- attr(*, "assign")= int [1:2] 0 1 ## .. ..$ qraux: num [1:2] 1.29 1.29 ## .. ..$ pivot: int [1:2] 1 2 ## .. ..$ tol : num 1e-07 ## .. ..$ rank : int 2 ## .. ..- attr(*, "class")= chr "qr" ## ..$ df.residual : int 10 ## ..$ xlevels : Named list() ## ..$ call : language lm(formula = percent ~ pce, data = .x) ## ..$ terms :Classes 'terms', 'formula' language percent ~ pce ## .. .. ..- attr(*, "variables")= language list(percent, pce) ## .. .. ..- attr(*, "factors")= int [1:2, 1] 0 1 ## .. .. .. ..- attr(*, "dimnames")=List of 2 ## .. .. .. .. ..$ : chr [1:2] "percent" "pce" ## .. .. .. .. ..$ : chr "pce" ## .. .. ..- attr(*, "term.labels")= chr "pce" ## .. .. ..- attr(*, "order")= int 1 ## .. .. ..- attr(*, "intercept")= int 1 ## .. .. ..- attr(*, "response")= int 1 ## .. .. ..- attr(*, ".Environment")=<environment: 0x7f8010455f80> ## .. .. ..- attr(*, "predvars")= language list(percent, pce) ## .. .. ..- attr(*, "dataClasses")= Named chr [1:2] "numeric" "numeric" ## .. .. .. ..- attr(*, "names")= chr [1:2] "percent" "pce" ## ..$ model :'data.frame': 12 obs. of 2 variables: ## .. ..$ percent: num [1:12] 0.0237 0.0241 0.0237 0.0239 0.0234 ... ## .. ..$ pce : num [1:12] 9060 9090 9122 9175 9215 ... ## .. ..- attr(*, "terms")=Classes 'terms', 'formula' language percent ~ pce ## .. .. .. ..- attr(*, "variables")= language list(percent, pce) ## .. .. .. ..- attr(*, "factors")= int [1:2, 1] 0 1 ## .. .. .. .. ..- attr(*, "dimnames")=List of 2 ## .. .. .. .. .. ..$ : chr [1:2] "percent" "pce" ## .. .. .. .. .. ..$ : chr "pce" ## .. .. .. ..- attr(*, "term.labels")= chr "pce" ## .. .. .. ..- attr(*, "order")= int 1 ## .. .. .. ..- attr(*, "intercept")= int 1 ## .. .. .. ..- attr(*, "response")= int 1 ## .. .. .. ..- attr(*, ".Environment")=<environment: 0x7f8010455f80> ## .. .. .. ..- attr(*, "predvars")= language list(percent, pce) ## .. .. .. ..- attr(*, "dataClasses")= Named chr [1:2] "numeric" "numeric" ## .. .. .. .. ..- attr(*, "names")= chr [1:2] "percent" "pce" ## ..- attr(*, "class")= chr "lm" ## $ 2007:List of 12 ## ..$ coefficients : Named num [1:2] -1.72e-02 4.19e-06 ## .. ..- attr(*, "names")= chr [1:2] "(Intercept)" "pce" ## ..$ residuals : Named num [1:12] 0.001044 0.00027 -0.000558 -0.000309 -0.000754 ... ## .. ..- attr(*, "names")= chr [1:12] "1" "2" "3" "4" ... ## ..$ effects : Named num [1:12] -0.081153 0.001834 -0.000797 -0.000546 -0.000988 ... ## .. ..- attr(*, "names")= chr [1:12] "(Intercept)" "pce" "" "" ... ## ..$ rank : int 2 ## ..$ fitted.values: Named num [1:12] 0.0226 0.0228 0.0229 0.023 0.0232 ... ## .. ..- attr(*, "names")= chr [1:12] "1" "2" "3" "4" ... ## ..$ assign : int [1:2] 0 1 ## ..$ qr :List of 5 ## .. ..$ qr : num [1:12, 1:2] -3.464 0.289 0.289 0.289 0.289 ... ## .. .. ..- attr(*, "dimnames")=List of 2 ## .. .. .. ..$ : chr [1:12] "1" "2" "3" "4" ... ## .. .. .. ..$ : chr [1:2] "(Intercept)" "pce" ## .. .. ..- attr(*, "assign")= int [1:2] 0 1 ## .. ..$ qraux: num [1:2] 1.29 1.27 ## .. ..$ pivot: int [1:2] 1 2 ## .. ..$ tol : num 1e-07 ## .. ..$ rank : int 2 ## .. ..- attr(*, "class")= chr "qr" ## ..$ df.residual : int 10 ## ..$ xlevels : Named list() ## ..$ call : language lm(formula = percent ~ pce, data = .x) ## ..$ terms :Classes 'terms', 'formula' language percent ~ pce ## .. .. ..- attr(*, "variables")= language list(percent, pce) ## .. .. ..- attr(*, "factors")= int [1:2, 1] 0 1 ## .. .. .. ..- attr(*, "dimnames")=List of 2 ## .. .. .. .. ..$ : chr [1:2] "percent" "pce" ## .. .. .. .. ..$ : chr "pce" ## .. .. ..- attr(*, "term.labels")= chr "pce" ## .. .. ..- attr(*, "order")= int 1 ## .. .. ..- attr(*, "intercept")= int 1 ## .. .. ..- attr(*, "response")= int 1 ## .. .. ..- attr(*, ".Environment")=<environment: 0x7f80104ba178> ## .. .. ..- attr(*, "predvars")= language list(percent, pce) ## .. .. ..- attr(*, "dataClasses")= Named chr [1:2] "numeric" "numeric" ## .. .. .. ..- attr(*, "names")= chr [1:2] "percent" "pce" ## ..$ model :'data.frame': 12 obs. of 2 variables: ## .. ..$ percent: num [1:12] 0.0237 0.023 0.0224 0.0227 0.0224 ... ## .. ..$ pce : num [1:12] 9516 9547 9585 9616 9651 ... ## .. ..- attr(*, "terms")=Classes 'terms', 'formula' language percent ~ pce ## .. .. .. ..- attr(*, "variables")= language list(percent, pce) ## .. .. .. ..- attr(*, "factors")= int [1:2, 1] 0 1 ## .. .. .. .. ..- attr(*, "dimnames")=List of 2 ## .. .. .. .. .. ..$ : chr [1:2] "percent" "pce" ## .. .. .. .. .. ..$ : chr "pce" ## .. .. .. ..- attr(*, "term.labels")= chr "pce" ## .. .. .. ..- attr(*, "order")= int 1 ## .. .. .. ..- attr(*, "intercept")= int 1 ## .. .. .. ..- attr(*, "response")= int 1 ## .. .. .. ..- attr(*, ".Environment")=<environment: 0x7f80104ba178> ## .. .. .. ..- attr(*, "predvars")= language list(percent, pce) ## .. .. .. ..- attr(*, "dataClasses")= Named chr [1:2] "numeric" "numeric" ## .. .. .. .. ..- attr(*, "names")= chr [1:2] "percent" "pce" ## ..- attr(*, "class")= chr "lm" ## $ 2008:List of 12 ## ..$ coefficients : Named num [1:2] 1.78e-01 -1.49e-05 ## .. ..- attr(*, "names")= chr [1:2] "(Intercept)" "pce" ## ..$ residuals : Named num [1:12] -0.004727 -0.005612 -0.003871 -0.003938 -0.000612 ... ## .. ..- attr(*, "names")= chr [1:12] "1" "2" "3" "4" ... ## ..$ effects : Named num [1:12] -0.101691 -0.005787 -0.002744 -0.003198 -0.000463 ... ## .. ..- attr(*, "names")= chr [1:12] "(Intercept)" "pce" "" "" ... ## ..$ rank : int 2 ## ..$ fitted.values: Named num [1:12] 0.03 0.0303 0.0296 0.029 0.0282 ... ## .. ..- attr(*, "names")= chr [1:12] "1" "2" "3" "4" ... ## ..$ assign : int [1:2] 0 1 ## ..$ qr :List of 5 ## .. ..$ qr : num [1:12, 1:2] -3.464 0.289 0.289 0.289 0.289 ... ## .. .. ..- attr(*, "dimnames")=List of 2 ## .. .. .. ..$ : chr [1:12] "1" "2" "3" "4" ... ## .. .. .. ..$ : chr [1:2] "(Intercept)" "pce" ## .. .. ..- attr(*, "assign")= int [1:2] 0 1 ## .. ..$ qraux: num [1:2] 1.29 1.14 ## .. ..$ pivot: int [1:2] 1 2 ## .. ..$ tol : num 1e-07 ## .. ..$ rank : int 2 ## .. ..- attr(*, "class")= chr "qr" ## ..$ df.residual : int 10 ## ..$ xlevels : Named list() ## ..$ call : language lm(formula = percent ~ pce, data = .x) ## ..$ terms :Classes 'terms', 'formula' language percent ~ pce ## .. .. ..- attr(*, "variables")= language list(percent, pce) ## .. .. ..- attr(*, "factors")= int [1:2, 1] 0 1 ## .. .. .. ..- attr(*, "dimnames")=List of 2 ## .. .. .. .. ..$ : chr [1:2] "percent" "pce" ## .. .. .. .. ..$ : chr "pce" ## .. .. ..- attr(*, "term.labels")= chr "pce" ## .. .. ..- attr(*, "order")= int 1 ## .. .. ..- attr(*, "intercept")= int 1 ## .. .. ..- attr(*, "response")= int 1 ## .. .. ..- attr(*, ".Environment")=<environment: 0x7f80105685a0> ## .. .. ..- attr(*, "predvars")= language list(percent, pce) ## .. .. ..- attr(*, "dataClasses")= Named chr [1:2] "numeric" "numeric" ## .. .. .. ..- attr(*, "names")= chr [1:2] "percent" "pce" ## ..$ model :'data.frame': 12 obs. of 2 variables: ## .. ..$ percent: num [1:12] 0.0253 0.0247 0.0257 0.0251 0.0276 ... ## .. ..$ pce : num [1:12] 9930 9913 9959 9997 10054 ... ## .. ..- attr(*, "terms")=Classes 'terms', 'formula' language percent ~ pce ## .. .. .. ..- attr(*, "variables")= language list(percent, pce) ## .. .. .. ..- attr(*, "factors")= int [1:2, 1] 0 1 ## .. .. .. .. ..- attr(*, "dimnames")=List of 2 ## .. .. .. .. .. ..$ : chr [1:2] "percent" "pce" ## .. .. .. .. .. ..$ : chr "pce" ## .. .. .. ..- attr(*, "term.labels")= chr "pce" ## .. .. .. ..- attr(*, "order")= int 1 ## .. .. .. ..- attr(*, "intercept")= int 1 ## .. .. .. ..- attr(*, "response")= int 1 ## .. .. .. ..- attr(*, ".Environment")=<environment: 0x7f80105685a0> ## .. .. .. ..- attr(*, "predvars")= language list(percent, pce) ## .. .. .. ..- attr(*, "dataClasses")= Named chr [1:2] "numeric" "numeric" ## .. .. .. .. ..- attr(*, "names")= chr [1:2] "percent" "pce" ## ..- attr(*, "class")= chr "lm" ## $ 2009:List of 12 ## ..$ coefficients : Named num [1:2] -1.73e-01 2.23e-05 ## .. ..- attr(*, "names")= chr [1:2] "(Intercept)" "pce" ## ..$ residuals : Named num [1:12] -5.82e-03 -2.70e-03 5.17e-05 1.27e-03 2.81e-03 ... ## .. ..- attr(*, "names")= chr [1:12] "1" "2" "3" "4" ... ## ..$ effects : Named num [1:12] -0.16107 0.00727 0.00175 0.00295 0.0044 ... ## .. ..- attr(*, "names")= chr [1:12] "(Intercept)" "pce" "" "" ... ## ..$ rank : int 2 ## ..$ fitted.values: Named num [1:12] 0.0452 0.0448 0.0437 0.0439 0.0444 ... ## .. ..- attr(*, "names")= chr [1:12] "1" "2" "3" "4" ... ## ..$ assign : int [1:2] 0 1 ## ..$ qr :List of 5 ## .. ..$ qr : num [1:12, 1:2] -3.464 0.289 0.289 0.289 0.289 ... ## .. .. ..- attr(*, "dimnames")=List of 2 ## .. .. .. ..$ : chr [1:12] "1" "2" "3" "4" ... ## .. .. .. ..$ : chr [1:2] "(Intercept)" "pce" ## .. .. ..- attr(*, "assign")= int [1:2] 0 1 ## .. ..$ qraux: num [1:2] 1.29 1.19 ## .. ..$ pivot: int [1:2] 1 2 ## .. ..$ tol : num 1e-07 ## .. ..$ rank : int 2 ## .. ..- attr(*, "class")= chr "qr" ## ..$ df.residual : int 10 ## ..$ xlevels : Named list() ## ..$ call : language lm(formula = percent ~ pce, data = .x) ## ..$ terms :Classes 'terms', 'formula' language percent ~ pce ## .. .. ..- attr(*, "variables")= language list(percent, pce) ## .. .. ..- attr(*, "factors")= int [1:2, 1] 0 1 ## .. .. .. ..- attr(*, "dimnames")=List of 2 ## .. .. .. .. ..$ : chr [1:2] "percent" "pce" ## .. .. .. .. ..$ : chr "pce" ## .. .. ..- attr(*, "term.labels")= chr "pce" ## .. .. ..- attr(*, "order")= int 1 ## .. .. ..- attr(*, "intercept")= int 1 ## .. .. ..- attr(*, "response")= int 1 ## .. .. ..- attr(*, ".Environment")=<environment: 0x7f80105c9fb8> ## .. .. ..- attr(*, "predvars")= language list(percent, pce) ## .. .. ..- attr(*, "dataClasses")= Named chr [1:2] "numeric" "numeric" ## .. .. .. ..- attr(*, "names")= chr [1:2] "percent" "pce" ## ..$ model :'data.frame': 12 obs. of 2 variables: ## .. ..$ percent: num [1:12] 0.0394 0.0421 0.0438 0.0452 0.0472 ... ## .. ..$ pce : num [1:12] 9784 9766 9718 9725 9749 ... ## .. ..- attr(*, "terms")=Classes 'terms', 'formula' language percent ~ pce ## .. .. .. ..- attr(*, "variables")= language list(percent, pce) ## .. .. .. ..- attr(*, "factors")= int [1:2, 1] 0 1 ## .. .. .. .. ..- attr(*, "dimnames")=List of 2 ## .. .. .. .. .. ..$ : chr [1:2] "percent" "pce" ## .. .. .. .. .. ..$ : chr "pce" ## .. .. .. ..- attr(*, "term.labels")= chr "pce" ## .. .. .. ..- attr(*, "order")= int 1 ## .. .. .. ..- attr(*, "intercept")= int 1 ## .. .. .. ..- attr(*, "response")= int 1 ## .. .. .. ..- attr(*, ".Environment")=<environment: 0x7f80105c9fb8> ## .. .. .. ..- attr(*, "predvars")= language list(percent, pce) ## .. .. .. ..- attr(*, "dataClasses")= Named chr [1:2] "numeric" "numeric" ## .. .. .. .. ..- attr(*, "names")= chr [1:2] "percent" "pce" ## ..- attr(*, "class")= chr "lm" ## $ 2010:List of 12 ## ..$ coefficients : Named num [1:2] 1.07e-01 -5.84e-06 ## .. ..- attr(*, "names")= chr [1:2] "(Intercept)" "pce" ## ..$ residuals : Named num [1:12] -0.000166 0.000189 0.000789 0.001329 -0.000132 ... ## .. ..- attr(*, "names")= chr [1:12] "1" "2" "3" "4" ... ## ..$ effects : Named num [1:12] -0.165615 -0.002394 0.000802 0.001353 -0.000101 ... ## .. ..- attr(*, "names")= chr [1:12] "(Intercept)" "pce" "" "" ... ## ..$ rank : int 2 ## ..$ fitted.values: Named num [1:12] 0.0489 0.0487 0.0484 0.0482 0.0481 ... ## .. ..- attr(*, "names")= chr [1:12] "1" "2" "3" "4" ... ## ..$ assign : int [1:2] 0 1 ## ..$ qr :List of 5 ## .. ..$ qr : num [1:12, 1:2] -3.464 0.289 0.289 0.289 0.289 ... ## .. .. ..- attr(*, "dimnames")=List of 2 ## .. .. .. ..$ : chr [1:12] "1" "2" "3" "4" ... ## .. .. .. ..$ : chr [1:2] "(Intercept)" "pce" ## .. .. ..- attr(*, "assign")= int [1:2] 0 1 ## .. ..$ qraux: num [1:2] 1.29 1.28 ## .. ..$ pivot: int [1:2] 1 2 ## .. ..$ tol : num 1e-07 ## .. ..$ rank : int 2 ## .. ..- attr(*, "class")= chr "qr" ## ..$ df.residual : int 10 ## ..$ xlevels : Named list() ## ..$ call : language lm(formula = percent ~ pce, data = .x) ## ..$ terms :Classes 'terms', 'formula' language percent ~ pce ## .. .. ..- attr(*, "variables")= language list(percent, pce) ## .. .. ..- attr(*, "factors")= int [1:2, 1] 0 1 ## .. .. .. ..- attr(*, "dimnames")=List of 2 ## .. .. .. .. ..$ : chr [1:2] "percent" "pce" ## .. .. .. .. ..$ : chr "pce" ## .. .. ..- attr(*, "term.labels")= chr "pce" ## .. .. ..- attr(*, "order")= int 1 ## .. .. ..- attr(*, "intercept")= int 1 ## .. .. ..- attr(*, "response")= int 1 ## .. .. ..- attr(*, ".Environment")=<environment: 0x7f8010639ea0> ## .. .. ..- attr(*, "predvars")= language list(percent, pce) ## .. .. ..- attr(*, "dataClasses")= Named chr [1:2] "numeric" "numeric" ## .. .. .. ..- attr(*, "names")= chr [1:2] "percent" "pce" ## ..$ model :'data.frame': 12 obs. of 2 variables: ## .. ..$ percent: num [1:12] 0.0487 0.0489 0.0492 0.0496 0.048 ... ## .. ..$ pce : num [1:12] 10002 10031 10089 10113 10131 ... ## .. ..- attr(*, "terms")=Classes 'terms', 'formula' language percent ~ pce ## .. .. .. ..- attr(*, "variables")= language list(percent, pce) ## .. .. .. ..- attr(*, "factors")= int [1:2, 1] 0 1 ## .. .. .. .. ..- attr(*, "dimnames")=List of 2 ## .. .. .. .. .. ..$ : chr [1:2] "percent" "pce" ## .. .. .. .. .. ..$ : chr "pce" ## .. .. .. ..- attr(*, "term.labels")= chr "pce" ## .. .. .. ..- attr(*, "order")= int 1 ## .. .. .. ..- attr(*, "intercept")= int 1 ## .. .. .. ..- attr(*, "response")= int 1 ## .. .. .. ..- attr(*, ".Environment")=<environment: 0x7f8010639ea0> ## .. .. .. ..- attr(*, "predvars")= language list(percent, pce) ## .. .. .. ..- attr(*, "dataClasses")= Named chr [1:2] "numeric" "numeric" ## .. .. .. .. ..- attr(*, "names")= chr [1:2] "percent" "pce" ## ..- attr(*, "class")= chr "lm" ## $ 2011:List of 12 ## ..$ coefficients : Named num [1:2] 1.04e-01 -5.65e-06 ## .. ..- attr(*, "names")= chr [1:2] "(Intercept)" "pce" ## ..$ residuals : Named num [1:12] -0.000141 -0.000588 -0.000423 0.000469 0.000255 ... ## .. ..- attr(*, "names")= chr [1:12] "1" "2" "3" "4" ... ## ..$ effects : Named num [1:12] -0.152571 -0.002124 -0.000341 0.000509 0.000268 ... ## .. ..- attr(*, "names")= chr [1:12] "(Intercept)" "pce" "" "" ... ## ..$ rank : int 2 ## ..$ fitted.values: Named num [1:12] 0.0452 0.045 0.0446 0.0443 0.0442 ... ## .. ..- attr(*, "names")= chr [1:12] "1" "2" "3" "4" ... ## ..$ assign : int [1:2] 0 1 ## ..$ qr :List of 5 ## .. ..$ qr : num [1:12, 1:2] -3.464 0.289 0.289 0.289 0.289 ... ## .. .. ..- attr(*, "dimnames")=List of 2 ## .. .. .. ..$ : chr [1:12] "1" "2" "3" "4" ... ## .. .. .. ..$ : chr [1:2] "(Intercept)" "pce" ## .. .. ..- attr(*, "assign")= int [1:2] 0 1 ## .. ..$ qraux: num [1:2] 1.29 1.33 ## .. ..$ pivot: int [1:2] 1 2 ## .. ..$ tol : num 1e-07 ## .. ..$ rank : int 2 ## .. ..- attr(*, "class")= chr "qr" ## ..$ df.residual : int 10 ## ..$ xlevels : Named list() ## ..$ call : language lm(formula = percent ~ pce, data = .x) ## ..$ terms :Classes 'terms', 'formula' language percent ~ pce ## .. .. ..- attr(*, "variables")= language list(percent, pce) ## .. .. ..- attr(*, "factors")= int [1:2, 1] 0 1 ## .. .. .. ..- attr(*, "dimnames")=List of 2 ## .. .. .. .. ..$ : chr [1:2] "percent" "pce" ## .. .. .. .. ..$ : chr "pce" ## .. .. ..- attr(*, "term.labels")= chr "pce" ## .. .. ..- attr(*, "order")= int 1 ## .. .. ..- attr(*, "intercept")= int 1 ## .. .. ..- attr(*, "response")= int 1 ## .. .. ..- attr(*, ".Environment")=<environment: 0x7f80106bb730> ## .. .. ..- attr(*, "predvars")= language list(percent, pce) ## .. .. ..- attr(*, "dataClasses")= Named chr [1:2] "numeric" "numeric" ## .. .. .. ..- attr(*, "names")= chr [1:2] "percent" "pce" ## ..$ model :'data.frame': 12 obs. of 2 variables: ## .. ..$ percent: num [1:12] 0.0451 0.0444 0.0441 0.0448 0.0445 ... ## .. ..$ pce : num [1:12] 10436 10470 10550 10588 10612 ... ## .. ..- attr(*, "terms")=Classes 'terms', 'formula' language percent ~ pce ## .. .. .. ..- attr(*, "variables")= language list(percent, pce) ## .. .. .. ..- attr(*, "factors")= int [1:2, 1] 0 1 ## .. .. .. .. ..- attr(*, "dimnames")=List of 2 ## .. .. .. .. .. ..$ : chr [1:2] "percent" "pce" ## .. .. .. .. .. ..$ : chr "pce" ## .. .. .. ..- attr(*, "term.labels")= chr "pce" ## .. .. .. ..- attr(*, "order")= int 1 ## .. .. .. ..- attr(*, "intercept")= int 1 ## .. .. .. ..- attr(*, "response")= int 1 ## .. .. .. ..- attr(*, ".Environment")=<environment: 0x7f80106bb730> ## .. .. .. ..- attr(*, "predvars")= language list(percent, pce) ## .. .. .. ..- attr(*, "dataClasses")= Named chr [1:2] "numeric" "numeric" ## .. .. .. .. ..- attr(*, "names")= chr [1:2] "percent" "pce" ## ..- attr(*, "class")= chr "lm" ## $ 2012:List of 12 ## ..$ coefficients : Named num [1:2] 1.58e-01 -1.07e-05 ## .. ..- attr(*, "names")= chr [1:2] "(Intercept)" "pce" ## ..$ residuals : Named num [1:12] -0.000475 0.000534 0.000176 0.000239 0.000144 ... ## .. ..- attr(*, "names")= chr [1:12] "1" "2" "3" "4" ... ## ..$ effects : Named num [1:12] -0.137828 -0.003027 0.000234 0.000357 0.000238 ... ## .. ..- attr(*, "names")= chr [1:12] "(Intercept)" "pce" "" "" ... ## ..$ rank : int 2 ## ..$ fitted.values: Named num [1:12] 0.0413 0.0404 0.0404 0.0401 0.0402 ... ## .. ..- attr(*, "names")= chr [1:12] "1" "2" "3" "4" ... ## ..$ assign : int [1:2] 0 1 ## ..$ qr :List of 5 ## .. ..$ qr : num [1:12, 1:2] -3.464 0.289 0.289 0.289 0.289 ... ## .. .. ..- attr(*, "dimnames")=List of 2 ## .. .. .. ..$ : chr [1:12] "1" "2" "3" "4" ... ## .. .. .. ..$ : chr [1:2] "(Intercept)" "pce" ## .. .. ..- attr(*, "assign")= int [1:2] 0 1 ## .. ..$ qraux: num [1:2] 1.29 1.07 ## .. ..$ pivot: int [1:2] 1 2 ## .. ..$ tol : num 1e-07 ## .. ..$ rank : int 2 ## .. ..- attr(*, "class")= chr "qr" ## ..$ df.residual : int 10 ## ..$ xlevels : Named list() ## ..$ call : language lm(formula = percent ~ pce, data = .x) ## ..$ terms :Classes 'terms', 'formula' language percent ~ pce ## .. .. ..- attr(*, "variables")= language list(percent, pce) ## .. .. ..- attr(*, "factors")= int [1:2, 1] 0 1 ## .. .. .. ..- attr(*, "dimnames")=List of 2 ## .. .. .. .. ..$ : chr [1:2] "percent" "pce" ## .. .. .. .. ..$ : chr "pce" ## .. .. ..- attr(*, "term.labels")= chr "pce" ## .. .. ..- attr(*, "order")= int 1 ## .. .. ..- attr(*, "intercept")= int 1 ## .. .. ..- attr(*, "response")= int 1 ## .. .. ..- attr(*, ".Environment")=<environment: 0x7f801071aea8> ## .. .. ..- attr(*, "predvars")= language list(percent, pce) ## .. .. ..- attr(*, "dataClasses")= Named chr [1:2] "numeric" "numeric" ## .. .. .. ..- attr(*, "names")= chr [1:2] "percent" "pce" ## ..$ model :'data.frame': 12 obs. of 2 variables: ## .. ..$ percent: num [1:12] 0.0409 0.0409 0.0406 0.0403 0.0403 ... ## .. ..$ pce : num [1:12] 10862 10954 10952 10980 10969 ... ## .. ..- attr(*, "terms")=Classes 'terms', 'formula' language percent ~ pce ## .. .. .. ..- attr(*, "variables")= language list(percent, pce) ## .. .. .. ..- attr(*, "factors")= int [1:2, 1] 0 1 ## .. .. .. .. ..- attr(*, "dimnames")=List of 2 ## .. .. .. .. .. ..$ : chr [1:2] "percent" "pce" ## .. .. .. .. .. ..$ : chr "pce" ## .. .. .. ..- attr(*, "term.labels")= chr "pce" ## .. .. .. ..- attr(*, "order")= int 1 ## .. .. .. ..- attr(*, "intercept")= int 1 ## .. .. .. ..- attr(*, "response")= int 1 ## .. .. .. ..- attr(*, ".Environment")=<environment: 0x7f801071aea8> ## .. .. .. ..- attr(*, "predvars")= language list(percent, pce) ## .. .. .. ..- attr(*, "dataClasses")= Named chr [1:2] "numeric" "numeric" ## .. .. .. .. ..- attr(*, "names")= chr [1:2] "percent" "pce" ## ..- attr(*, "class")= chr "lm" ## $ 2013:List of 12 ## ..$ coefficients : Named num [1:2] 2.10e-01 -1.54e-05 ## .. ..- attr(*, "names")= chr [1:2] "(Intercept)" "pce" ## ..$ residuals : Named num [1:12] 0.001561 0.000459 -0.000577 -0.000704 -0.000456 ... ## .. ..- attr(*, "names")= chr [1:12] "1" "2" "3" "4" ... ## ..$ effects : Named num [1:12] -0.125478 -0.005544 -0.000944 -0.001076 -0.000819 ... ## .. ..- attr(*, "names")= chr [1:12] "(Intercept)" "pce" "" "" ... ## ..$ rank : int 2 ## ..$ fitted.values: Named num [1:12] 0.038 0.0374 0.0376 0.0379 0.0373 ... ## .. ..- attr(*, "names")= chr [1:12] "1" "2" "3" "4" ... ## ..$ assign : int [1:2] 0 1 ## ..$ qr :List of 5 ## .. ..$ qr : num [1:12, 1:2] -3.464 0.289 0.289 0.289 0.289 ... ## .. .. ..- attr(*, "dimnames")=List of 2 ## .. .. .. ..$ : chr [1:12] "1" "2" "3" "4" ... ## .. .. .. ..$ : chr [1:2] "(Intercept)" "pce" ## .. .. ..- attr(*, "assign")= int [1:2] 0 1 ## .. ..$ qraux: num [1:2] 1.29 1.14 ## .. ..$ pivot: int [1:2] 1 2 ## .. ..$ tol : num 1e-07 ## .. ..$ rank : int 2 ## .. ..- attr(*, "class")= chr "qr" ## ..$ df.residual : int 10 ## ..$ xlevels : Named list() ## ..$ call : language lm(formula = percent ~ pce, data = .x) ## ..$ terms :Classes 'terms', 'formula' language percent ~ pce ## .. .. ..- attr(*, "variables")= language list(percent, pce) ## .. .. ..- attr(*, "factors")= int [1:2, 1] 0 1 ## .. .. .. ..- attr(*, "dimnames")=List of 2 ## .. .. .. .. ..$ : chr [1:2] "percent" "pce" ## .. .. .. .. ..$ : chr "pce" ## .. .. ..- attr(*, "term.labels")= chr "pce" ## .. .. ..- attr(*, "order")= int 1 ## .. .. ..- attr(*, "intercept")= int 1 ## .. .. ..- attr(*, "response")= int 1 ## .. .. ..- attr(*, ".Environment")=<environment: 0x7f80107a5d38> ## .. .. ..- attr(*, "predvars")= language list(percent, pce) ## .. .. ..- attr(*, "dataClasses")= Named chr [1:2] "numeric" "numeric" ## .. .. .. ..- attr(*, "names")= chr [1:2] "percent" "pce" ## ..$ model :'data.frame': 12 obs. of 2 variables: ## .. ..$ percent: num [1:12] 0.0395 0.0379 0.037 0.0372 0.0369 ... ## .. ..$ pce : num [1:12] 11203 11240 11227 11205 11245 ... ## .. ..- attr(*, "terms")=Classes 'terms', 'formula' language percent ~ pce ## .. .. .. ..- attr(*, "variables")= language list(percent, pce) ## .. .. .. ..- attr(*, "factors")= int [1:2, 1] 0 1 ## .. .. .. .. ..- attr(*, "dimnames")=List of 2 ## .. .. .. .. .. ..$ : chr [1:2] "percent" "pce" ## .. .. .. .. .. ..$ : chr "pce" ## .. .. .. ..- attr(*, "term.labels")= chr "pce" ## .. .. .. ..- attr(*, "order")= int 1 ## .. .. .. ..- attr(*, "intercept")= int 1 ## .. .. .. ..- attr(*, "response")= int 1 ## .. .. .. ..- attr(*, ".Environment")=<environment: 0x7f80107a5d38> ## .. .. .. ..- attr(*, "predvars")= language list(percent, pce) ## .. .. .. ..- attr(*, "dataClasses")= Named chr [1:2] "numeric" "numeric" ## .. .. .. .. ..- attr(*, "names")= chr [1:2] "percent" "pce" ## ..- attr(*, "class")= chr "lm" ## $ 2014:List of 12 ## ..$ coefficients : Named num [1:2] 1.32e-01 -8.59e-06 ## .. ..- attr(*, "names")= chr [1:2] "(Intercept)" "pce" ## ..$ residuals : Named num [1:12] -0.000692 0.000216 0.000957 -0.00068 0.000189 ... ## .. ..- attr(*, "names")= chr [1:12] "1" "2" "3" "4" ... ## ..$ effects : Named num [1:12] -0.104402 -0.005422 0.001061 -0.000549 0.000341 ... ## .. ..- attr(*, "names")= chr [1:12] "(Intercept)" "pce" "" "" ... ## ..$ rank : int 2 ## ..$ fitted.values: Named num [1:12] 0.0328 0.0324 0.0317 0.0312 0.0308 ... ## .. ..- attr(*, "names")= chr [1:12] "1" "2" "3" "4" ... ## ..$ assign : int [1:2] 0 1 ## ..$ qr :List of 5 ## .. ..$ qr : num [1:12, 1:2] -3.464 0.289 0.289 0.289 0.289 ... ## .. .. ..- attr(*, "dimnames")=List of 2 ## .. .. .. ..$ : chr [1:12] "1" "2" "3" "4" ... ## .. .. .. ..$ : chr [1:2] "(Intercept)" "pce" ## .. .. ..- attr(*, "assign")= int [1:2] 0 1 ## .. ..$ qraux: num [1:2] 1.29 1.3 ## .. ..$ pivot: int [1:2] 1 2 ## .. ..$ tol : num 1e-07 ## .. ..$ rank : int 2 ## .. ..- attr(*, "class")= chr "qr" ## ..$ df.residual : int 10 ## ..$ xlevels : Named list() ## ..$ call : language lm(formula = percent ~ pce, data = .x) ## ..$ terms :Classes 'terms', 'formula' language percent ~ pce ## .. .. ..- attr(*, "variables")= language list(percent, pce) ## .. .. ..- attr(*, "factors")= int [1:2, 1] 0 1 ## .. .. .. ..- attr(*, "dimnames")=List of 2 ## .. .. .. .. ..$ : chr [1:2] "percent" "pce" ## .. .. .. .. ..$ : chr "pce" ## .. .. ..- attr(*, "term.labels")= chr "pce" ## .. .. ..- attr(*, "order")= int 1 ## .. .. ..- attr(*, "intercept")= int 1 ## .. .. ..- attr(*, "response")= int 1 ## .. .. ..- attr(*, ".Environment")=<environment: 0x7f801384d270> ## .. .. ..- attr(*, "predvars")= language list(percent, pce) ## .. .. ..- attr(*, "dataClasses")= Named chr [1:2] "numeric" "numeric" ## .. .. .. ..- attr(*, "names")= chr [1:2] "percent" "pce" ## ..$ model :'data.frame': 12 obs. of 2 variables: ## .. ..$ percent: num [1:12] 0.0321 0.0326 0.0327 0.0305 0.031 ... ## .. ..$ pce : num [1:12] 11512 11566 11643 11703 11748 ... ## .. ..- attr(*, "terms")=Classes 'terms', 'formula' language percent ~ pce ## .. .. .. ..- attr(*, "variables")= language list(percent, pce) ## .. .. .. ..- attr(*, "factors")= int [1:2, 1] 0 1 ## .. .. .. .. ..- attr(*, "dimnames")=List of 2 ## .. .. .. .. .. ..$ : chr [1:2] "percent" "pce" ## .. .. .. .. .. ..$ : chr "pce" ## .. .. .. ..- attr(*, "term.labels")= chr "pce" ## .. .. .. ..- attr(*, "order")= int 1 ## .. .. .. ..- attr(*, "intercept")= int 1 ## .. .. .. ..- attr(*, "response")= int 1 ## .. .. .. ..- attr(*, ".Environment")=<environment: 0x7f801384d270> ## .. .. .. ..- attr(*, "predvars")= language list(percent, pce) ## .. .. .. ..- attr(*, "dataClasses")= Named chr [1:2] "numeric" "numeric" ## .. .. .. .. ..- attr(*, "names")= chr [1:2] "percent" "pce" ## ..- attr(*, "class")= chr "lm" ## $ 2015:List of 12 ## ..$ coefficients : Named num [1:2] 1.18e-01 -7.48e-06 ## .. ..- attr(*, "names")= chr [1:2] "(Intercept)" "pce" ## ..$ residuals : Named num [1:4] 0.0003 -0.000356 -0.000132 0.000188 ## .. ..- attr(*, "names")= chr [1:4] "1" "2" "3" "4" ## ..$ effects : Named num [1:4] -0.053947 -0.000879 -0.000452 -0.000256 ## .. ..- attr(*, "names")= chr [1:4] "(Intercept)" "pce" "" "" ## ..$ rank : int 2 ## ..$ fitted.values: Named num [1:4] 0.0275 0.0273 0.0267 0.0264 ## .. ..- attr(*, "names")= chr [1:4] "1" "2" "3" "4" ## ..$ assign : int [1:2] 0 1 ## ..$ qr :List of 5 ## .. ..$ qr : num [1:4, 1:2] -2 0.5 0.5 0.5 -24240.2 ... ## .. .. ..- attr(*, "dimnames")=List of 2 ## .. .. .. ..$ : chr [1:4] "1" "2" "3" "4" ## .. .. .. ..$ : chr [1:2] "(Intercept)" "pce" ## .. .. ..- attr(*, "assign")= int [1:2] 0 1 ## .. ..$ qraux: num [1:2] 1.5 1.11 ## .. ..$ pivot: int [1:2] 1 2 ## .. ..$ tol : num 1e-07 ## .. ..$ rank : int 2 ## .. ..- attr(*, "class")= chr "qr" ## ..$ df.residual : int 2 ## ..$ xlevels : Named list() ## ..$ call : language lm(formula = percent ~ pce, data = .x) ## ..$ terms :Classes 'terms', 'formula' language percent ~ pce ## .. .. ..- attr(*, "variables")= language list(percent, pce) ## .. .. ..- attr(*, "factors")= int [1:2, 1] 0 1 ## .. .. .. ..- attr(*, "dimnames")=List of 2 ## .. .. .. .. ..$ : chr [1:2] "percent" "pce" ## .. .. .. .. ..$ : chr "pce" ## .. .. ..- attr(*, "term.labels")= chr "pce" ## .. .. ..- attr(*, "order")= int 1 ## .. .. ..- attr(*, "intercept")= int 1 ## .. .. ..- attr(*, "response")= int 1 ## .. .. ..- attr(*, ".Environment")=<environment: 0x7f801338d878> ## .. .. ..- attr(*, "predvars")= language list(percent, pce) ## .. .. ..- attr(*, "dataClasses")= Named chr [1:2] "numeric" "numeric" ## .. .. .. ..- attr(*, "names")= chr [1:2] "percent" "pce" ## ..$ model :'data.frame': 4 obs. of 2 variables: ## .. ..$ percent: num [1:4] 0.0278 0.0269 0.0266 0.0266 ## .. ..$ pce : num [1:4] 12046 12082 12158 12194 ## .. ..- attr(*, "terms")=Classes 'terms', 'formula' language percent ~ pce ## .. .. .. ..- attr(*, "variables")= language list(percent, pce) ## .. .. .. ..- attr(*, "factors")= int [1:2, 1] 0 1 ## .. .. .. .. ..- attr(*, "dimnames")=List of 2 ## .. .. .. .. .. ..$ : chr [1:2] "percent" "pce" ## .. .. .. .. .. ..$ : chr "pce" ## .. .. .. ..- attr(*, "term.labels")= chr "pce" ## .. .. .. ..- attr(*, "order")= int 1 ## .. .. .. ..- attr(*, "intercept")= int 1 ## .. .. .. ..- attr(*, "response")= int 1 ## .. .. .. ..- attr(*, ".Environment")=<environment: 0x7f801338d878> ## .. .. .. ..- attr(*, "predvars")= language list(percent, pce) ## .. .. .. ..- attr(*, "dataClasses")= Named chr [1:2] "numeric" "numeric" ## .. .. .. .. ..- attr(*, "names")= chr [1:2] "percent" "pce" ## ..- attr(*, "class")= chr "lm" ``` --- # Extract coefficients ### You try first Hint: use `coef`. For example, see `coef(mods[[1]])` <div class="countdown" id="timer_6227eb32" style="right:0;bottom:0;" data-warnwhen="0"> <code class="countdown-time"><span class="countdown-digits minutes">02</span><span class="countdown-digits colon">:</span><span class="countdown-digits seconds">00</span></code> </div> -- ```r coefs <- map(mods, coef) coefs[c(1:2, length(coefs))] ``` ``` ## $`1967` ## (Intercept) pce ## 8.397192e-03 1.307101e-05 ## ## $`1968` ## (Intercept) pce ## 2.784626e-02 -2.496983e-05 ## ## $`2015` ## (Intercept) pce ## 1.176573e-01 -7.482080e-06 ``` --- # Extract slopes AKA - the coefficient that is not the intercept ### You try first <div class="countdown" id="timer_6227e90d" style="right:0;bottom:0;" data-warnwhen="0"> <code class="countdown-time"><span class="countdown-digits minutes">02</span><span class="countdown-digits colon">:</span><span class="countdown-digits seconds">00</span></code> </div> -- ```r slopes <- map_dbl(coefs, 2) slopes ``` ``` ## 1967 1968 1969 1970 1971 1972 ## 1.307101e-05 -2.496983e-05 3.201794e-05 2.136662e-04 1.177357e-05 -2.708060e-05 ## 1973 1974 1975 1976 1977 1978 ## -6.047148e-06 8.050869e-05 -1.643992e-06 9.413733e-06 -3.366894e-05 -1.151756e-05 ## 1979 1980 1981 1982 1983 1984 ## 5.011539e-06 2.350410e-05 3.150845e-05 6.516215e-05 -4.402208e-05 -1.718497e-05 ## 1985 1986 1987 1988 1989 1990 ## -6.926535e-06 -6.782516e-06 -1.980421e-05 -7.174276e-06 4.436762e-06 2.611286e-05 ## 1991 1992 1993 1994 1995 1996 ## 1.842612e-05 6.091330e-07 -1.371548e-05 -2.102375e-05 7.718004e-07 -5.567328e-06 ## 1997 1998 1999 2000 2001 2002 ## -9.936855e-06 -2.283149e-06 -2.893646e-06 -1.601844e-06 3.001365e-05 2.014789e-06 ## 2003 2004 2005 2006 2007 2008 ## -1.306818e-06 -3.640025e-06 -3.679151e-06 -3.368536e-06 4.187576e-06 -1.494605e-05 ## 2009 2010 2011 2012 2013 2014 ## 2.230078e-05 -5.844266e-06 -5.647401e-06 -1.070319e-05 -1.536441e-05 -8.590683e-06 ## 2015 ## -7.482080e-06 ``` --- # Plot * I trust you can do this ```r relation <- tibble(year = names(slopes), slope = slopes) ggplot(relation, aes(slope)) + geom_histogram(fill = "cornflowerblue", color = "white") ``` <!-- --> --- # Piping We could also have done the previous in a pipeline. ```r by_year %>% map(~mutate(.x, percent = unemploy / pop)) ``` ``` ## $`1967` ## # A tibble: 6 × 8 ## date pce pop psavert uempmed unemploy year percent ## <date> <dbl> <dbl> <dbl> <dbl> <dbl> <dbl> <dbl> ## 1 1967-07-01 506.7 198712 12.6 4.5 2944 1967 0.01481541 ## 2 1967-08-01 509.8 198911 12.6 4.7 2945 1967 0.01480562 ## 3 1967-09-01 515.6 199113 11.9 4.6 2958 1967 0.01485589 ## 4 1967-10-01 512.2 199311 12.9 4.9 3143 1967 0.01576933 ## 5 1967-11-01 517.4 199498 12.8 4.7 3066 1967 0.01536858 ## 6 1967-12-01 525.1 199657 11.8 4.8 3018 1967 0.01511592 ## ## $`1968` ## # A tibble: 12 × 8 ## date pce pop psavert uempmed unemploy year percent ## <date> <dbl> <dbl> <dbl> <dbl> <dbl> <dbl> <dbl> ## 1 1968-01-01 530.9 199808 11.7 5.1 2878 1968 0.01440383 ## 2 1968-02-01 533.6 199920 12.3 4.5 3001 1968 0.01501100 ## 3 1968-03-01 544.3 200056 11.7 4.1 2877 1968 0.01438097 ## 4 1968-04-01 544 200208 12.3 4.6 2709 1968 0.01353093 ## 5 1968-05-01 549.8 200361 12 4.4 2740 1968 0.01367532 ## 6 1968-06-01 556.3 200536 11.7 4.4 2938 1968 0.01465074 ## 7 1968-07-01 563.2 200706 10.7 4.5 2883 1968 0.01436429 ## 8 1968-08-01 567 200898 10.5 4.2 2768 1968 0.01377814 ## 9 1968-09-01 568.2 201095 10.6 4.6 2686 1968 0.01335687 ## 10 1968-10-01 571.6 201290 10.8 4.8 2689 1968 0.01335884 ## 11 1968-11-01 576.7 201466 10.6 4.4 2715 1968 0.01347622 ## 12 1968-12-01 576.5 201621 11.1 4.4 2685 1968 0.01331707 ## ## $`1969` ## # A tibble: 12 × 8 ## date pce pop psavert uempmed unemploy year percent ## <date> <dbl> <dbl> <dbl> <dbl> <dbl> <dbl> <dbl> ## 1 1969-01-01 583.5 201760 10.3 4.4 2718 1969 0.01347145 ## 2 1969-02-01 588.7 201881 9.7 4.9 2692 1969 0.01333459 ## 3 1969-03-01 588.9 202023 10.2 4 2712 1969 0.01342421 ## 4 1969-04-01 593.9 202161 9.7 4 2758 1969 0.01364259 ## 5 1969-05-01 600.3 202331 10.1 4.2 2713 1969 0.01340872 ## 6 1969-06-01 600.9 202507 11.1 4.4 2816 1969 0.01390569 ## 7 1969-07-01 602.7 202677 11.8 4.4 2868 1969 0.01415059 ## 8 1969-08-01 609.9 202877 11.5 4.4 2856 1969 0.01407750 ## 9 1969-09-01 613.2 203090 11.6 4.7 3040 1969 0.01496873 ## 10 1969-10-01 618.5 203302 11.4 4.5 3049 1969 0.01499739 ## 11 1969-11-01 620.5 203500 11.6 4.8 2856 1969 0.01403440 ## 12 1969-12-01 622.8 203675 11.8 4.6 2884 1969 0.01415981 ## ## $`1970` ## # A tibble: 12 × 8 ## date pce pop psavert uempmed unemploy year percent ## <date> <dbl> <dbl> <dbl> <dbl> <dbl> <dbl> <dbl> ## 1 1970-01-01 628.7 203849 11.8 4.6 3201 1970 0.01570280 ## 2 1970-02-01 634 204008 11.7 4.5 3453 1970 0.01692581 ## 3 1970-03-01 632.3 204156 12.4 4.6 3635 1970 0.01780501 ## 4 1970-04-01 636 204401 13.3 4.1 3797 1970 0.01857623 ## 5 1970-05-01 642.4 204607 12.4 4.7 3919 1970 0.01915379 ## 6 1970-06-01 646.3 204830 12.3 4.9 4071 1970 0.01987502 ## 7 1970-07-01 648.5 205052 13.5 5.1 4175 1970 0.02036069 ## 8 1970-08-01 652.9 205295 13.4 5.4 4256 1970 0.02073114 ## 9 1970-09-01 659.1 205540 12.9 5.2 4456 1970 0.02167948 ## 10 1970-10-01 658.3 205788 13.1 5.2 4591 1970 0.02230937 ## 11 1970-11-01 656.6 206024 13.6 5.6 4898 1970 0.02377393 ## 12 1970-12-01 665.6 206238 13.2 5.9 5076 1970 0.02461234 ## ## $`1971` ## # A tibble: 12 × 8 ## date pce pop psavert uempmed unemploy year percent ## <date> <dbl> <dbl> <dbl> <dbl> <dbl> <dbl> <dbl> ## 1 1971-01-01 676.1 206466 13.3 6.2 4986 1971 0.02414925 ## 2 1971-02-01 679.4 206668 13.3 6.3 4903 1971 0.02372404 ## 3 1971-03-01 682 206855 13.5 6.4 4987 1971 0.02410868 ## 4 1971-04-01 688.8 207065 13.2 6.5 4959 1971 0.02394900 ## 5 1971-05-01 691.1 207260 13.6 6.7 4996 1971 0.02410499 ## 6 1971-06-01 699.8 207462 14.7 5.7 4949 1971 0.02385497 ## 7 1971-07-01 698.9 207661 13.8 6.2 5035 1971 0.02424625 ## 8 1971-08-01 704.9 207881 13.6 6.4 5134 1971 0.02469682 ## 9 1971-09-01 713 208114 13.3 5.8 5042 1971 0.02422711 ## 10 1971-10-01 715.8 208345 13.3 6.5 4954 1971 0.02377787 ## 11 1971-11-01 720.9 208555 13.1 6.4 5161 1971 0.02474647 ## 12 1971-12-01 728.4 208740 13 6.2 5154 1971 0.02469100 ## ## $`1972` ## # A tibble: 12 × 8 ## date pce pop psavert uempmed unemploy year percent ## <date> <dbl> <dbl> <dbl> <dbl> <dbl> <dbl> <dbl> ## 1 1972-01-01 731.5 208917 12.5 6.2 5019 1972 0.02402389 ## 2 1972-02-01 736.2 209061 12.8 6.6 4928 1972 0.02357207 ## 3 1972-03-01 749.2 209212 11.8 6.6 5038 1972 0.02408084 ## 4 1972-04-01 752.5 209386 11.5 6.7 4959 1972 0.02368353 ## 5 1972-05-01 758 209545 11.7 6.6 4922 1972 0.02348899 ## 6 1972-06-01 761.6 209725 11.7 5.4 4923 1972 0.02347360 ## 7 1972-07-01 769.9 209896 11.7 6.1 4913 1972 0.02340683 ## 8 1972-08-01 776.3 210075 12 6 4939 1972 0.02351065 ## 9 1972-09-01 781.1 210278 12.2 5.6 4849 1972 0.02305995 ## 10 1972-10-01 794.9 210479 13 5.7 4875 1972 0.02316146 ## 11 1972-11-01 800.5 210656 13.6 5.7 4602 1972 0.02184604 ## 12 1972-12-01 806.1 210821 13.7 6.1 4543 1972 0.02154909 ## ## $`1973` ## # A tibble: 12 × 8 ## date pce pop psavert uempmed unemploy year percent ## <date> <dbl> <dbl> <dbl> <dbl> <dbl> <dbl> <dbl> ## 1 1973-01-01 816.5 210985 12.4 5.7 4326 1973 0.02050383 ## 2 1973-02-01 825.8 211120 12.5 5.2 4452 1973 0.02108753 ## 3 1973-03-01 832.8 211254 12.7 5.5 4394 1973 0.02079961 ## 4 1973-04-01 835.7 211420 13.2 5 4459 1973 0.02109072 ## 5 1973-05-01 841.6 211577 13.2 4.9 4329 1973 0.02046064 ## 6 1973-06-01 844.3 211746 13.6 5 4363 1973 0.02060488 ## 7 1973-07-01 854.1 211909 13.2 5.2 4305 1973 0.02031532 ## 8 1973-08-01 853.3 212092 13.9 4.9 4305 1973 0.02029780 ## 9 1973-09-01 869.2 212289 13.1 5.4 4350 1973 0.02049093 ## 10 1973-10-01 868.2 212475 14.4 5.5 4144 1973 0.01950347 ## 11 1973-11-01 876.9 212634 14.4 5.1 4396 1973 0.02067402 ## 12 1973-12-01 876.6 212785 14.8 4.7 4489 1973 0.02109641 ## ## $`1974` ## # A tibble: 12 × 8 ## date pce pop psavert uempmed unemploy year percent ## <date> <dbl> <dbl> <dbl> <dbl> <dbl> <dbl> <dbl> ## 1 1974-01-01 884.5 212932 14.3 5 4644 1974 0.02180978 ## 2 1974-02-01 889.7 213074 14.2 5.1 4731 1974 0.02220355 ## 3 1974-03-01 901.4 213211 13.4 4.8 4634 1974 0.02173434 ## 4 1974-04-01 910.8 213361 13.1 5 4618 1974 0.02164407 ## 5 1974-05-01 922.4 213513 12.8 4.6 4705 1974 0.02203613 ## 6 1974-06-01 928 213686 12.8 5.3 4927 1974 0.02305720 ## 7 1974-07-01 937.9 213854 12.8 5.7 5063 1974 0.02367503 ## 8 1974-08-01 954.8 214042 12.1 5 5022 1974 0.02346268 ## 9 1974-09-01 955.1 214246 12.9 5.3 5437 1974 0.02537737 ## 10 1974-10-01 959.2 214451 13.4 5.5 5523 1974 0.02575413 ## 11 1974-11-01 956.2 214625 13.8 5.2 6140 1974 0.02860804 ## 12 1974-12-01 961.8 214782 14 5.7 6636 1974 0.03089644 ## ## $`1975` ## # A tibble: 12 × 8 ## date pce pop psavert uempmed unemploy year percent ## <date> <dbl> <dbl> <dbl> <dbl> <dbl> <dbl> <dbl> ## 1 1975-01-01 975.6 214931 13.2 6.3 7501 1975 0.03489957 ## 2 1975-02-01 989.4 215065 12.5 7.1 7520 1975 0.03496617 ## 3 1975-03-01 990.6 215198 12.7 7.2 7978 1975 0.03707284 ## 4 1975-04-01 995 215353 14.2 8.7 8210 1975 0.03812345 ## 5 1975-05-01 1018.9 215523 17.3 9.4 8433 1975 0.03912807 ## 6 1975-06-01 1026.8 215768 14.3 8.8 8220 1975 0.03809647 ## 7 1975-07-01 1039.8 215973 12.6 8.6 8127 1975 0.03762970 ## 8 1975-08-01 1047 216195 13 9.2 7928 1975 0.03667060 ## 9 1975-09-01 1054.8 216393 13 9.2 7923 1975 0.03661394 ## 10 1975-10-01 1060.9 216587 13.4 8.6 7897 1975 0.03646110 ## 11 1975-11-01 1075.8 216771 12.7 9.5 7794 1975 0.03595499 ## 12 1975-12-01 1092.1 216931 12 9 7744 1975 0.03569799 ## ## $`1976` ## # A tibble: 12 × 8 ## date pce pop psavert uempmed unemploy year percent ## <date> <dbl> <dbl> <dbl> <dbl> <dbl> <dbl> <dbl> ## 1 1976-01-01 1107.1 217095 11.7 9 7534 1976 0.03470370 ## 2 1976-02-01 1107.7 217249 12.3 8.2 7326 1976 0.03372167 ## 3 1976-03-01 1114.9 217381 12.2 8.7 7230 1976 0.03325958 ## 4 1976-04-01 1125.4 217528 11.7 8.2 7330 1976 0.03369681 ## 5 1976-05-01 1122.7 217685 12.3 8.3 7053 1976 0.03240003 ## 6 1976-06-01 1140.5 217861 11.4 7.8 7322 1976 0.03360859 ## 7 1976-07-01 1149.6 218035 11.7 7.7 7490 1976 0.03435228 ## 8 1976-08-01 1158 218233 11.7 7.9 7518 1976 0.03444942 ## 9 1976-09-01 1168.8 218440 11.4 7.8 7380 1976 0.03378502 ## 10 1976-10-01 1176.8 218644 11.1 7.7 7430 1976 0.03398218 ## 11 1976-11-01 1189 218834 11.4 8.4 7620 1976 0.03482091 ## 12 1976-12-01 1211.5 219006 10.6 8 7545 1976 0.03445111 ## ## $`1977` ## # A tibble: 12 × 8 ## date pce pop psavert uempmed unemploy year percent ## <date> <dbl> <dbl> <dbl> <dbl> <dbl> <dbl> <dbl> ## 1 1977-01-01 1215 219179 10.6 7.5 7280 1977 0.03321486 ## 2 1977-02-01 1231.3 219344 9.3 7.2 7443 1977 0.03393300 ## 3 1977-03-01 1238.3 219504 10.5 7.2 7307 1977 0.03328869 ## 4 1977-04-01 1247.3 219684 10.5 7.3 7059 1977 0.03213252 ## 5 1977-05-01 1257.1 219859 10.3 7.9 6911 1977 0.03143378 ## 6 1977-06-01 1263.6 220046 10.6 6.2 7134 1977 0.03242049 ## 7 1977-07-01 1280.5 220239 10.5 7.1 6829 1977 0.03100722 ## 8 1977-08-01 1285.7 220458 10.9 7 6925 1977 0.03141188 ## 9 1977-09-01 1294.5 220688 11.1 6.7 6751 1977 0.03059070 ## 10 1977-10-01 1311.4 220904 11 6.9 6763 1977 0.03061511 ## 11 1977-11-01 1327 221109 11.2 7 6815 1977 0.03082190 ## 12 1977-12-01 1336 221303 11.4 6.8 6386 1977 0.02885636 ## ## $`1978` ## # A tibble: 12 × 8 ## date pce pop psavert uempmed unemploy year percent ## <date> <dbl> <dbl> <dbl> <dbl> <dbl> <dbl> <dbl> ## 1 1978-01-01 1329.5 221477 11.9 6.5 6489 1978 0.02929875 ## 2 1978-02-01 1355.1 221629 11.1 6.7 6318 1978 0.02850710 ## 3 1978-03-01 1377.5 221792 11 6.2 6337 1978 0.02857182 ## 4 1978-04-01 1396.4 221991 10.8 6.1 6180 1978 0.02783897 ## 5 1978-05-01 1412 222176 10.3 5.7 6127 1978 0.02757724 ## 6 1978-06-01 1425.8 222379 10 6 6028 1978 0.02710688 ## 7 1978-07-01 1426.8 222585 10.9 5.8 6309 1978 0.02834423 ## 8 1978-08-01 1447 222805 10.5 5.8 6080 1978 0.02728844 ## 9 1978-09-01 1452.9 223053 10.6 5.6 6125 1978 0.02745984 ## 10 1978-10-01 1466.9 223271 10.7 5.9 5947 1978 0.02663579 ## 11 1978-11-01 1480.6 223477 10.5 5.5 6077 1978 0.02719295 ## 12 1978-12-01 1496.5 223670 10.4 5.6 6228 1978 0.02784459 ## ## $`1979` ## # A tibble: 12 × 8 ## date pce pop psavert uempmed unemploy year percent ## <date> <dbl> <dbl> <dbl> <dbl> <dbl> <dbl> <dbl> ## 1 1979-01-01 1502.4 223865 11.1 5.9 6109 1979 0.02728877 ## 2 1979-02-01 1517.8 224053 11.1 5.9 6173 1979 0.02755152 ## 3 1979-03-01 1531.2 224235 11.2 5.9 6109 1979 0.02724374 ## 4 1979-04-01 1538.4 224438 11 5.4 6069 1979 0.02704088 ## 5 1979-05-01 1558.8 224632 10.3 5.6 5840 1979 0.02599808 ## 6 1979-06-01 1575.7 224843 9.9 5.6 5959 1979 0.02650294 ## 7 1979-07-01 1586.1 225055 10.6 5.9 5996 1979 0.02664238 ## 8 1979-08-01 1615.6 225295 9.7 4.8 6320 1979 0.02805211 ## 9 1979-09-01 1633.9 225547 9.4 5.5 6190 1979 0.02744439 ## 10 1979-10-01 1641.6 225801 9.7 5.5 6296 1979 0.02788296 ## 11 1979-11-01 1657.3 226027 9.7 5.3 6238 1979 0.02759847 ## 12 1979-12-01 1666.3 226243 10.1 5.7 6325 1979 0.02795667 ## ## $`1980` ## # A tibble: 12 × 8 ## date pce pop psavert uempmed unemploy year percent ## <date> <dbl> <dbl> <dbl> <dbl> <dbl> <dbl> <dbl> ## 1 1980-01-01 1697.3 226451 9.9 5.3 6683 1980 0.02951190 ## 2 1980-02-01 1701.4 226656 10.1 5.8 6702 1980 0.02956904 ## 3 1980-03-01 1708.2 226849 10.2 6 6729 1980 0.02966290 ## 4 1980-04-01 1695.2 227061 11.3 5.8 7358 1980 0.03240539 ## 5 1980-05-01 1700.1 227251 11.4 5.7 7984 1980 0.03513296 ## 6 1980-06-01 1718.8 227522 11.2 6.4 8098 1980 0.03559216 ## 7 1980-07-01 1747.1 227726 11.3 7 8363 1980 0.03672396 ## 8 1980-08-01 1763.8 227953 11.3 7.5 8281 1980 0.03632766 ## 9 1980-09-01 1780.5 228186 11.7 7.7 8021 1980 0.03515115 ## 10 1980-10-01 1817.1 228417 11.3 7.5 8088 1980 0.03540892 ## 11 1980-11-01 1826.8 228612 11.6 7.7 8023 1980 0.03509440 ## 12 1980-12-01 1851.7 228779 11.4 7.5 7718 1980 0.03373561 ## ## $`1981` ## # A tibble: 12 × 8 ## date pce pop psavert uempmed unemploy year percent ## <date> <dbl> <dbl> <dbl> <dbl> <dbl> <dbl> <dbl> ## 1 1981-01-01 1870 228937 10.9 7.4 8071 1981 0.03525424 ## 2 1981-02-01 1884.2 229071 10.8 7.1 8051 1981 0.03514631 ## 3 1981-03-01 1902.9 229224 10.8 7.1 7982 1981 0.03482183 ## 4 1981-04-01 1904.4 229403 10.9 7.4 7869 1981 0.03430208 ## 5 1981-05-01 1913.8 229575 11 6.9 8174 1981 0.03560492 ## 6 1981-06-01 1934.5 229761 10.8 6.6 8098 1981 0.03524532 ## 7 1981-07-01 1942.1 229966 12.3 7.1 7863 1981 0.03419201 ## 8 1981-08-01 1966.6 230187 12 7.2 8036 1981 0.03491075 ## 9 1981-09-01 1965.5 230412 12.4 6.8 8230 1981 0.03571863 ## 10 1981-10-01 1963.9 230641 13 6.8 8646 1981 0.03748683 ## 11 1981-11-01 1970.6 230822 13.2 6.9 9029 1981 0.03911672 ## 12 1981-12-01 1988.8 230989 12.5 6.9 9267 1981 0.04011879 ## ## $`1982` ## # A tibble: 12 × 8 ## date pce pop psavert uempmed unemploy year percent ## <date> <dbl> <dbl> <dbl> <dbl> <dbl> <dbl> <dbl> ## 1 1982-01-01 1997.1 231157 12.7 7.1 9397 1982 0.04065202 ## 2 1982-02-01 2021.2 231313 12.1 7.5 9705 1982 0.04195614 ## 3 1982-03-01 2024.1 231470 12.2 7.7 9895 1982 0.04274852 ## 4 1982-04-01 2026.3 231645 12.9 8.1 10244 1982 0.04422284 ## 5 1982-05-01 2044.5 231809 12.3 8.5 10335 1982 0.04458412 ## 6 1982-06-01 2048.1 231992 12.3 9.5 10538 1982 0.04542398 ## 7 1982-07-01 2072.2 232188 12.5 8.5 10849 1982 0.04672507 ## 8 1982-08-01 2080.1 232392 12.6 8.7 10881 1982 0.04682175 ## 9 1982-09-01 2104.6 232599 11.8 9.5 11217 1982 0.04822463 ## 10 1982-10-01 2125.8 232816 11.3 9.7 11529 1982 0.04951979 ## 11 1982-11-01 2149.3 232993 10.9 10 11938 1982 0.05123759 ## 12 1982-12-01 2161.6 233160 10.9 10.2 12051 1982 0.05168554 ## ## $`1983` ## # A tibble: 12 × 8 ## date pce pop psavert uempmed unemploy year percent ## <date> <dbl> <dbl> <dbl> <dbl> <dbl> <dbl> <dbl> ## 1 1983-01-01 2174 233322 11.1 11.1 11534 1983 0.04943383 ## 2 1983-02-01 2177 233473 11.1 9.8 11545 1983 0.04944897 ## 3 1983-03-01 2202.8 233613 10.6 10.4 11408 1983 0.04883290 ## 4 1983-04-01 2226.4 233781 10.3 10.9 11268 1983 0.04819896 ## 5 1983-05-01 2245.9 233922 9.9 12.3 11154 1983 0.04768256 ## 6 1983-06-01 2276 234118 9.1 11.3 11246 1983 0.04803561 ## 7 1983-07-01 2304.4 234307 9.6 10.1 10548 1983 0.04501786 ## 8 1983-08-01 2320.4 234501 9.2 9.3 10623 1983 0.04530045 ## 9 1983-09-01 2334.9 234701 9.6 9.3 10282 1983 0.04380893 ## 10 1983-10-01 2357.6 234907 9.7 9.4 9887 1983 0.04208900 ## 11 1983-11-01 2366.3 235078 10.3 9.3 9499 1983 0.04040786 ## 12 1983-12-01 2393.6 235235 10.1 8.7 9331 1983 0.03966672 ## ## $`1984` ## # A tibble: 12 × 8 ## date pce pop psavert uempmed unemploy year percent ## <date> <dbl> <dbl> <dbl> <dbl> <dbl> <dbl> <dbl> ## 1 1984-01-01 2419.4 235385 10 9.1 9008 1984 0.03826922 ## 2 1984-02-01 2403.5 235527 11.7 8.3 8791 1984 0.03732481 ## 3 1984-03-01 2431.6 235675 11.5 8.3 8746 1984 0.03711043 ## 4 1984-04-01 2457.5 235839 11.5 8.2 8762 1984 0.03715246 ## 5 1984-05-01 2474.5 235993 11.1 9.1 8456 1984 0.03583157 ## 6 1984-06-01 2495.6 236160 11.1 7.5 8226 1984 0.03483232 ## 7 1984-07-01 2494.6 236348 11.6 7.5 8537 1984 0.03612047 ## 8 1984-08-01 2512.2 236549 11.8 7.3 8519 1984 0.03601368 ## 9 1984-09-01 2533.8 236760 11.8 7.6 8367 1984 0.03533958 ## 10 1984-10-01 2531.3 236976 11.7 7.2 8381 1984 0.03536645 ## 11 1984-11-01 2571.4 237159 10.9 7.2 8198 1984 0.03456753 ## 12 1984-12-01 2582.6 237316 11.2 7.3 8358 1984 0.03521886 ## ## $`1985` ## # A tibble: 12 × 8 ## date pce pop psavert uempmed unemploy year percent ## <date> <dbl> <dbl> <dbl> <dbl> <dbl> <dbl> <dbl> ## 1 1985-01-01 2618.8 237468 10.3 6.8 8423 1985 0.03547004 ## 2 1985-02-01 2640.8 237602 9.1 7.1 8321 1985 0.03502075 ## 3 1985-03-01 2648.5 237732 8.7 7.1 8339 1985 0.03507731 ## 4 1985-04-01 2659.5 237900 9.9 6.9 8395 1985 0.03528794 ## 5 1985-05-01 2696.4 238074 11.1 6.9 8302 1985 0.03487151 ## 6 1985-06-01 2689.4 238270 9.6 6.6 8460 1985 0.03550594 ## 7 1985-07-01 2715.7 238466 9.1 6.9 8513 1985 0.03569901 ## 8 1985-08-01 2752.1 238679 8.2 7.1 8196 1985 0.03433901 ## 9 1985-09-01 2794.7 238898 7.3 6.9 8248 1985 0.03452519 ## 10 1985-10-01 2755.8 239113 9.1 7.1 8298 1985 0.03470326 ## 11 1985-11-01 2771.1 239307 9 7 8128 1985 0.03396474 ## 12 1985-12-01 2811.3 239477 8.6 6.8 8138 1985 0.03398239 ## ## $`1986` ## # A tibble: 12 × 8 ## date pce pop psavert uempmed unemploy year percent ## <date> <dbl> <dbl> <dbl> <dbl> <dbl> <dbl> <dbl> ## 1 1986-01-01 2827.1 239638 8.6 6.7 7795 1986 0.03252823 ## 2 1986-02-01 2820.2 239788 9.3 6.9 8402 1986 0.03503928 ## 3 1986-03-01 2823.6 239928 9.9 6.8 8383 1986 0.03493965 ## 4 1986-04-01 2835.2 240094 9.7 6.7 8364 1986 0.03483636 ## 5 1986-05-01 2857.5 240271 9.3 6.8 8439 1986 0.03512284 ## 6 1986-06-01 2861.7 240459 9.4 7 8508 1986 0.03538233 ## 7 1986-07-01 2881.2 240651 9.3 6.9 8319 1986 0.03456873 ## 8 1986-08-01 2898.6 240854 9 7.1 8135 1986 0.03377565 ## 9 1986-09-01 2971.8 241068 7.2 7.4 8310 1986 0.03447160 ## 10 1986-10-01 2932.9 241274 8.4 7 8243 1986 0.03416448 ## 11 1986-11-01 2928.4 241467 8.8 7.1 8159 1986 0.03378930 ## 12 1986-12-01 2997.1 241620 7 7.1 7883 1986 0.03262561 ## ## $`1987` ## # A tibble: 12 × 8 ## date pce pop psavert uempmed unemploy year percent ## <date> <dbl> <dbl> <dbl> <dbl> <dbl> <dbl> <dbl> ## 1 1987-01-01 2935.5 241784 9.7 6.9 7892 1987 0.03264070 ## 2 1987-02-01 3001.7 241930 8.5 6.6 7865 1987 0.03250940 ## 3 1987-03-01 3013.3 242079 8.5 6.6 7862 1987 0.03247700 ## 4 1987-04-01 3038.8 242252 4.5 7.1 7542 1987 0.03113287 ## 5 1987-05-01 3048.4 242423 8.2 6.6 7574 1987 0.03124291 ## 6 1987-06-01 3072.8 242608 7.7 6.5 7398 1987 0.03049364 ## 7 1987-07-01 3094.7 242804 7.5 6.5 7268 1987 0.02993361 ## 8 1987-08-01 3130.8 243012 7.2 6.4 7261 1987 0.02987918 ## 9 1987-09-01 3126.5 243223 7.6 6 7102 1987 0.02919954 ## 10 1987-10-01 3134.5 243446 8.3 6.3 7227 1987 0.02968625 ## 11 1987-11-01 3144.2 243639 8.5 6.2 7035 1987 0.02887469 ## 12 1987-12-01 3174.1 243809 8.7 6 6936 1987 0.02844850 ## ## $`1988` ## # A tibble: 12 × 8 ## date pce pop psavert uempmed unemploy year percent ## <date> <dbl> <dbl> <dbl> <dbl> <dbl> <dbl> <dbl> ## 1 1988-01-01 3213.7 243981 8.1 6.2 6953 1988 0.02849812 ## 2 1988-02-01 3221.4 244131 8.6 6.3 6929 1988 0.02838230 ## 3 1988-03-01 3260.5 244279 8.2 6.4 6876 1988 0.02814814 ## 4 1988-04-01 3263 244445 8.8 5.9 6601 1988 0.02700403 ## 5 1988-05-01 3293.6 244610 8.4 5.9 6779 1988 0.02771350 ## 6 1988-06-01 3318.5 244806 8.4 5.8 6546 1988 0.02673954 ## 7 1988-07-01 3342.7 245021 8.6 6.1 6605 1988 0.02695687 ## 8 1988-08-01 3368 245240 8.4 5.9 6843 1988 0.02790328 ## 9 1988-09-01 3375 245464 8.9 5.7 6604 1988 0.02690415 ## 10 1988-10-01 3413.7 245693 8.6 5.6 6568 1988 0.02673255 ## 11 1988-11-01 3430.2 245884 8.4 5.7 6537 1988 0.02658571 ## 12 1988-12-01 3459.7 246056 8.3 5.9 6518 1988 0.02648990 ## ## $`1989` ## # A tibble: 12 × 8 ## date pce pop psavert uempmed unemploy year percent ## <date> <dbl> <dbl> <dbl> <dbl> <dbl> <dbl> <dbl> ## 1 1989-01-01 3483.7 246224 8.5 5.6 6682 1989 0.02713789 ## 2 1989-02-01 3488 246378 9 5.4 6359 1989 0.02580993 ## 3 1989-03-01 3498.8 246530 9.5 5.4 6205 1989 0.02516935 ## 4 1989-04-01 3543 246721 8.4 5.4 6468 1989 0.02621585 ## 5 1989-05-01 3551.8 246906 8.1 5.3 6375 1989 0.02581954 ## 6 1989-06-01 3566.6 247114 8.2 5.4 6577 1989 0.02661525 ## 7 1989-07-01 3585.7 247342 8.2 5.6 6495 1989 0.02625919 ## 8 1989-08-01 3620.6 247573 7.6 5 6511 1989 0.02629931 ## 9 1989-09-01 3621.9 247816 8.1 4.9 6590 1989 0.02659231 ## 10 1989-10-01 3633.6 248067 8.5 4.9 6630 1989 0.02672665 ## 11 1989-11-01 3643.3 248281 8.6 4.8 6725 1989 0.02708625 ## 12 1989-12-01 3684.2 248479 7.8 4.9 6667 1989 0.02683124 ## ## $`1990` ## # A tibble: 12 × 8 ## date pce pop psavert uempmed unemploy year percent ## <date> <dbl> <dbl> <dbl> <dbl> <dbl> <dbl> <dbl> ## 1 1990-01-01 3730.7 248659 8 5.1 6752 1990 0.02715365 ## 2 1990-02-01 3728.2 248827 8.6 5.3 6651 1990 0.02672941 ## 3 1990-03-01 3754.9 249012 8.3 5.1 6598 1990 0.02649672 ## 4 1990-04-01 3770 249306 8.8 4.8 6797 1990 0.02726368 ## 5 1990-05-01 3775.8 249565 8.7 5.2 6742 1990 0.02701501 ## 6 1990-06-01 3804.5 249849 8.6 5.2 6590 1990 0.02637593 ## 7 1990-07-01 3821.7 250132 8.7 5.4 6922 1990 0.02767339 ## 8 1990-08-01 3848.3 250439 8.1 5.4 7188 1990 0.02870160 ## 9 1990-09-01 3870.1 250751 8.1 5.6 7368 1990 0.02938373 ## 10 1990-10-01 3870.6 251057 7.8 5.8 7459 1990 0.02971038 ## 11 1990-11-01 3871.9 251346 7.9 5.7 7764 1990 0.03088969 ## 12 1990-12-01 3861.3 251626 8.8 5.9 7901 1990 0.03139978 ## ## $`1991` ## # A tibble: 12 × 8 ## date pce pop psavert uempmed unemploy year percent ## <date> <dbl> <dbl> <dbl> <dbl> <dbl> <dbl> <dbl> ## 1 1991-01-01 3841 251889 9.3 6 8015 1991 0.03181957 ## 2 1991-02-01 3866.7 252135 8.8 6.2 8265 1991 0.03278006 ## 3 1991-03-01 3913 252372 8 6.7 8586 1991 0.03402121 ## 4 1991-04-01 3907.1 252643 8.6 6.6 8439 1991 0.03340286 ## 5 1991-05-01 3933.2 252913 8.4 6.4 8736 1991 0.03454152 ## 6 1991-06-01 3940.5 253207 8.9 6.9 8692 1991 0.03432764 ## 7 1991-07-01 3966 253493 8.2 7 8586 1991 0.03387076 ## 8 1991-08-01 3969.1 253807 8.6 7.3 8666 1991 0.03414405 ## 9 1991-09-01 3984.7 254126 8.8 6.8 8722 1991 0.03432156 ## 10 1991-10-01 3976 254435 9.3 7.2 8842 1991 0.03475151 ## 11 1991-11-01 4003.6 254718 9 7.5 8931 1991 0.03506230 ## 12 1991-12-01 4020.5 254964 9.7 7.8 9198 1991 0.03607568 ## ## $`1992` ## # A tibble: 12 × 8 ## date pce pop psavert uempmed unemploy year percent ## <date> <dbl> <dbl> <dbl> <dbl> <dbl> <dbl> <dbl> ## 1 1992-01-01 4084.7 255214 9.4 8.1 9283 1992 0.03637340 ## 2 1992-02-01 4099.5 255448 9.8 8.2 9454 1992 0.03700949 ## 3 1992-03-01 4117 255703 9.7 8.3 9460 1992 0.03699605 ## 4 1992-04-01 4131.5 255992 9.9 8.5 9415 1992 0.03677849 ## 5 1992-05-01 4158.4 256285 9.9 8.8 9744 1992 0.03802017 ## 6 1992-06-01 4177.1 256589 10.1 8.7 10040 1992 0.03912872 ## 7 1992-07-01 4204.8 256894 9.6 8.6 9850 1992 0.03834266 ## 8 1992-08-01 4220.9 257232 9.7 8.8 9787 1992 0.03804737 ## 9 1992-09-01 4255.3 257548 8.7 8.6 9781 1992 0.03797739 ## 10 1992-10-01 4284.7 257861 8 9 9398 1992 0.03644599 ## 11 1992-11-01 4300.5 258147 8 9 9565 1992 0.03705253 ## 12 1992-12-01 4336.4 258413 10.6 9.3 9557 1992 0.03698343 ## ## $`1993` ## # A tibble: 12 × 8 ## date pce pop psavert uempmed unemploy year percent ## <date> <dbl> <dbl> <dbl> <dbl> <dbl> <dbl> <dbl> ## 1 1993-01-01 4340.7 258679 8.6 8.6 9325 1993 0.03604854 ## 2 1993-02-01 4355.3 258919 8.9 8.5 9183 1993 0.03546669 ## 3 1993-03-01 4352.5 259152 8.9 8.5 9056 1993 0.03494474 ## 4 1993-04-01 4393.4 259414 8.7 8.4 9110 1993 0.03511761 ## 5 1993-05-01 4422.4 259680 8.3 8.1 9149 1993 0.03523182 ## 6 1993-06-01 4440 259963 7.8 8.3 9121 1993 0.03508576 ## 7 1993-07-01 4468.9 260255 7.6 8.2 8930 1993 0.03431250 ## 8 1993-08-01 4481.1 260566 7.7 8.2 8763 1993 0.03363063 ## 9 1993-09-01 4511.5 260867 6.9 8.3 8714 1993 0.03340400 ## 10 1993-10-01 4532.8 261163 6.3 8 8750 1993 0.03350398 ## 11 1993-11-01 4554.1 261425 6.3 8.3 8542 1993 0.03267476 ## 12 1993-12-01 4571.1 261674 9.1 8.3 8477 1993 0.03239527 ## ## $`1994` ## # A tibble: 12 × 8 ## date pce pop psavert uempmed unemploy year percent ## <date> <dbl> <dbl> <dbl> <dbl> <dbl> <dbl> <dbl> ## 1 1994-01-01 4585.1 261919 7.1 8.6 8630 1994 0.03294912 ## 2 1994-02-01 4632.6 262123 6.5 9.2 8583 1994 0.03274417 ## 3 1994-03-01 4646 262352 6.8 9.3 8470 1994 0.03228487 ## 4 1994-04-01 4671.1 262631 6.4 9.1 8331 1994 0.03172131 ## 5 1994-05-01 4669.5 262877 7.6 9.2 7915 1994 0.03010914 ## 6 1994-06-01 4708.9 263152 6.9 9.3 7927 1994 0.03012327 ## 7 1994-07-01 4720.6 263436 7 9 7946 1994 0.03016292 ## 8 1994-08-01 4762.6 263724 6.5 8.9 7933 1994 0.03008069 ## 9 1994-09-01 4775 264017 6.8 9.2 7734 1994 0.02929357 ## 10 1994-10-01 4812.9 264301 7.1 10 7632 1994 0.02887617 ## 11 1994-11-01 4825.6 264559 7 9 7375 1994 0.02787658 ## 12 1994-12-01 4841.6 264804 7.2 8.7 7230 1994 0.02730321 ## ## $`1995` ## # A tibble: 12 × 8 ## date pce pop psavert uempmed unemploy year percent ## <date> <dbl> <dbl> <dbl> <dbl> <dbl> <dbl> <dbl> ## 1 1995-01-01 4851.2 265044 7.5 8 7375 1995 0.02782557 ## 2 1995-02-01 4850.8 265270 7.8 8.1 7187 1995 0.02709315 ## 3 1995-03-01 4885.4 265495 7.5 8.3 7153 1995 0.02694213 ## 4 1995-04-01 4890.2 265755 6.9 8.3 7645 1995 0.02876710 ## 5 1995-05-01 4933.1 265998 7.1 9.1 7430 1995 0.02793254 ## 6 1995-06-01 4977.5 266270 6.7 7.9 7427 1995 0.02789274 ## 7 1995-07-01 4970.2 266557 7.1 8.5 7527 1995 0.02823786 ## 8 1995-08-01 5005.3 266843 6.7 8.3 7484 1995 0.02804645 ## 9 1995-09-01 5020.5 267152 6.8 7.9 7478 1995 0.02799156 ## 10 1995-10-01 5013.9 267456 7.1 8.2 7328 1995 0.02739890 ## 11 1995-11-01 5055.6 267715 6.6 8 7426 1995 0.02773845 ## 12 1995-12-01 5097.5 267943 6.1 8.3 7423 1995 0.02770365 ## ## $`1996` ## # A tibble: 12 × 8 ## date pce pop psavert uempmed unemploy year percent ## <date> <dbl> <dbl> <dbl> <dbl> <dbl> <dbl> <dbl> ## 1 1996-01-01 5085.7 268151 6.7 8.3 7491 1996 0.02793575 ## 2 1996-02-01 5132.8 268364 6.7 7.8 7313 1996 0.02725030 ## 3 1996-03-01 5173.3 268595 6.6 8.3 7318 1996 0.02724548 ## 4 1996-04-01 5208 268853 5.7 8.6 7415 1996 0.02758013 ## 5 1996-05-01 5223.8 269108 6.7 8.6 7423 1996 0.02758372 ## 6 1996-06-01 5229.8 269386 7.1 8.3 7095 1996 0.02633767 ## 7 1996-07-01 5251.9 269667 6.7 8.3 7337 1996 0.02720763 ## 8 1996-08-01 5275 269976 6.6 8.4 6882 1996 0.02549115 ## 9 1996-09-01 5296.6 270284 6.7 8.5 6979 1996 0.02582099 ## 10 1996-10-01 5328.5 270581 6.4 8.3 7031 1996 0.02598483 ## 11 1996-11-01 5351.2 270878 6.4 7.7 7236 1996 0.02671313 ## 12 1996-12-01 5378.6 271125 6.4 7.8 7253 1996 0.02675150 ## ## $`1997` ## # A tibble: 12 × 8 ## date pce pop psavert uempmed unemploy year percent ## <date> <dbl> <dbl> <dbl> <dbl> <dbl> <dbl> <dbl> ## 1 1997-01-01 5411.1 271360 6.2 7.8 7158 1997 0.02637824 ## 2 1997-02-01 5434 271585 6.2 8.1 7102 1997 0.02615019 ## 3 1997-03-01 5454.2 271821 6.4 7.9 7000 1997 0.02575224 ## 4 1997-04-01 5459.3 272083 6.5 8.3 6873 1997 0.02526067 ## 5 1997-05-01 5460.2 272342 6.8 8 6655 1997 0.02443619 ## 6 1997-06-01 5494.2 272622 6.6 8 6799 1997 0.02493929 ## 7 1997-07-01 5548.8 272912 6.1 8.3 6655 1997 0.02438515 ## 8 1997-08-01 5587 273237 6 7.8 6608 1997 0.02418413 ## 9 1997-09-01 5601.7 273553 6.2 8.2 6656 1997 0.02433167 ## 10 1997-10-01 5637.7 273852 6.2 7.7 6454 1997 0.02356747 ## 11 1997-11-01 5661.1 274126 6.4 7.6 6308 1997 0.02301132 ## 12 1997-12-01 5692.1 274372 6.4 7.5 6476 1997 0.02360299 ## ## $`1998` ## # A tibble: 12 × 8 ## date pce pop psavert uempmed unemploy year percent ## <date> <dbl> <dbl> <dbl> <dbl> <dbl> <dbl> <dbl> ## 1 1998-01-01 5689.9 274626 7.4 7.4 6368 1998 0.02318790 ## 2 1998-02-01 5723.8 274838 7.4 7 6306 1998 0.02294443 ## 3 1998-03-01 5750.3 275047 7.5 6.8 6422 1998 0.02334874 ## 4 1998-04-01 5788.1 275304 7.2 6.7 5941 1998 0.02157978 ## 5 1998-05-01 5837.9 275564 6.9 6 6047 1998 0.02194409 ## 6 1998-06-01 5871.7 275836 6.8 6.9 6212 1998 0.02252063 ## 7 1998-07-01 5890 276115 6.9 6.7 6259 1998 0.02266809 ## 8 1998-08-01 5925 276418 6.8 6.8 6179 1998 0.02235383 ## 9 1998-09-01 5965.6 276714 6.4 6.7 6300 1998 0.02276719 ## 10 1998-10-01 5998.8 277003 6.2 5.8 6280 1998 0.02267123 ## 11 1998-11-01 6015.4 277277 6.3 6.6 6100 1998 0.02199966 ## 12 1998-12-01 6070.5 277526 5.8 6.8 6032 1998 0.02173490 ## ## $`1999` ## # A tibble: 12 × 8 ## date pce pop psavert uempmed unemploy year percent ## <date> <dbl> <dbl> <dbl> <dbl> <dbl> <dbl> <dbl> ## 1 1999-01-01 6072.9 277790 6.4 6.9 5976 1999 0.02151265 ## 2 1999-02-01 6101.8 277992 6.2 6.8 6111 1999 0.02198265 ## 3 1999-03-01 6132.9 278198 5.9 6.8 5783 1999 0.02078735 ## 4 1999-04-01 6196.2 278451 5.2 6.2 6004 1999 0.02156214 ## 5 1999-05-01 6225.7 278717 4.9 6.5 5796 1999 0.02079529 ## 6 1999-06-01 6254 279001 4.8 6.3 5951 1999 0.02132967 ## 7 1999-07-01 6281.5 279295 4.8 5.8 6025 1999 0.02157217 ## 8 1999-08-01 6326.5 279602 4.7 6.5 5838 1999 0.02087968 ## 9 1999-09-01 6378.8 279903 4.2 6 5915 1999 0.02113232 ## 10 1999-10-01 6402.1 280203 4.6 6.1 5778 1999 0.02062076 ## 11 1999-11-01 6437.9 280471 4.8 6.2 5716 1999 0.02038000 ## 12 1999-12-01 6538.7 280716 4.4 5.8 5653 1999 0.02013779 ## ## $`2000` ## # A tibble: 12 × 8 ## date pce pop psavert uempmed unemploy year percent ## <date> <dbl> <dbl> <dbl> <dbl> <dbl> <dbl> <dbl> ## 1 2000-01-01 6535.3 280976 5.4 5.8 5708 2000 0.02031490 ## 2 2000-02-01 6619.7 281190 4.8 6.1 5858 2000 0.02083289 ## 3 2000-03-01 6685.8 281409 4.5 6 5733 2000 0.02037248 ## 4 2000-04-01 6671.1 281653 5 6.1 5481 2000 0.01946012 ## 5 2000-05-01 6707.6 281877 4.9 5.8 5758 2000 0.02042735 ## 6 2000-06-01 6743.9 282126 4.9 5.7 5651 2000 0.02003006 ## 7 2000-07-01 6764.1 282385 5.2 6 5747 2000 0.02035165 ## 8 2000-08-01 6799.1 282653 5.2 6.3 5853 2000 0.02070737 ## 9 2000-09-01 6882.9 282932 4.5 5.2 5625 2000 0.01988110 ## 10 2000-10-01 6888.2 283201 4.6 6.1 5534 2000 0.01954089 ## 11 2000-11-01 6902.4 283453 4.5 6.1 5639 2000 0.01989395 ## 12 2000-12-01 6945.7 283696 4.2 6 5634 2000 0.01985929 ## ## $`2001` ## # A tibble: 12 × 8 ## date pce pop psavert uempmed unemploy year percent ## <date> <dbl> <dbl> <dbl> <dbl> <dbl> <dbl> <dbl> ## 1 2001-01-01 6977 283920 4.8 5.8 6023 2001 0.02121372 ## 2 2001-02-01 6995.8 284137 4.9 6.1 6089 2001 0.02142980 ## 3 2001-03-01 6987.9 284350 5.3 6.6 6141 2001 0.02159662 ## 4 2001-04-01 7001.2 284581 5 5.9 6271 2001 0.02203591 ## 5 2001-05-01 7047.1 284810 4.5 6.3 6226 2001 0.02186019 ## 6 2001-06-01 7060.7 285062 4.5 6 6484 2001 0.02274593 ## 7 2001-07-01 7072.2 285309 5.6 6.8 6583 2001 0.02307323 ## 8 2001-08-01 7108.9 285570 6.8 6.9 7042 2001 0.02465945 ## 9 2001-09-01 7012.8 285843 7 7.2 7142 2001 0.02498574 ## 10 2001-10-01 7208.4 286098 3.4 7.3 7694 2001 0.02689288 ## 11 2001-11-01 7167.9 286341 4.1 7.7 8003 2001 0.02794919 ## 12 2001-12-01 7147.7 286570 4.5 8.2 8258 2001 0.02881669 ## ## $`2002` ## # A tibble: 12 × 8 ## date pce pop psavert uempmed unemploy year percent ## <date> <dbl> <dbl> <dbl> <dbl> <dbl> <dbl> <dbl> ## 1 2002-01-01 7174.3 286788 6.1 8.4 8182 2002 0.02852979 ## 2 2002-02-01 7218.3 286994 5.8 8.3 8215 2002 0.02862429 ## 3 2002-03-01 7237.2 287190 5.9 8.4 8304 2002 0.02891466 ## 4 2002-04-01 7305.4 287397 5.8 8.9 8599 2002 0.02992028 ## 5 2002-05-01 7282.7 287623 6.5 9.5 8399 2002 0.02920142 ## 6 2002-06-01 7318.2 287864 6.4 11 8393 2002 0.02915613 ## 7 2002-07-01 7380.4 288105 5.5 8.9 8390 2002 0.02912133 ## 8 2002-08-01 7401.5 288360 5.4 9 8304 2002 0.02879734 ## 9 2002-09-01 7391 288618 5.7 9.5 8251 2002 0.02858796 ## 10 2002-10-01 7430.7 288870 5.7 9.6 8307 2002 0.02875688 ## 11 2002-11-01 7459.7 289106 5.7 9.3 8520 2002 0.02947016 ## 12 2002-12-01 7512.8 289313 5.5 9.6 8640 2002 0.02986385 ## ## $`2003` ## # A tibble: 12 × 8 ## date pce pop psavert uempmed unemploy year percent ## <date> <dbl> <dbl> <dbl> <dbl> <dbl> <dbl> <dbl> ## 1 2003-01-01 7533.1 289518 5.5 9.6 8520 2003 0.02942822 ## 2 2003-02-01 7535.9 289714 5.6 9.5 8618 2003 0.02974658 ## 3 2003-03-01 7598.4 289911 5.3 9.7 8588 2003 0.02962288 ## 4 2003-04-01 7621 290125 5.3 10.2 8842 2003 0.03047652 ## 5 2003-05-01 7628.1 290346 5.8 9.9 8957 2003 0.03084940 ## 6 2003-06-01 7678.6 290584 5.6 11.5 9266 2003 0.03188751 ## 7 2003-07-01 7738.2 290820 6.3 10.3 9011 2003 0.03098480 ## 8 2003-08-01 7834.5 291072 6 10.1 8896 2003 0.03056288 ## 9 2003-09-01 7835 291321 5.2 10.2 8921 2003 0.03062258 ## 10 2003-10-01 7845.7 291574 5.3 10.4 8732 2003 0.02994780 ## 11 2003-11-01 7899.6 291807 5.4 10.3 8576 2003 0.02938929 ## 12 2003-12-01 7929.2 292008 5.4 10.4 8317 2003 0.02848210 ## ## $`2004` ## # A tibble: 12 × 8 ## date pce pop psavert uempmed unemploy year percent ## <date> <dbl> <dbl> <dbl> <dbl> <dbl> <dbl> <dbl> ## 1 2004-01-01 7987.4 292192 5 10.6 8370 2004 0.02864555 ## 2 2004-02-01 8019.8 292368 5 10.2 8167 2004 0.02793397 ## 3 2004-03-01 8076 292561 4.9 10.2 8491 2004 0.02902301 ## 4 2004-04-01 8088.6 292779 5.3 9.5 8170 2004 0.02790501 ## 5 2004-05-01 8163.2 292997 5.3 9.9 8212 2004 0.02802759 ## 6 2004-06-01 8147.2 293223 5.8 11 8286 2004 0.02825836 ## 7 2004-07-01 8218.9 293463 5.3 8.9 8136 2004 0.02772411 ## 8 2004-08-01 8253.1 293719 5.2 9.2 7990 2004 0.02720287 ## 9 2004-09-01 8321.1 293971 4.6 9.6 7927 2004 0.02696524 ## 10 2004-10-01 8374.6 294230 4.5 9.5 8061 2004 0.02739693 ## 11 2004-11-01 8420.6 294466 4.1 9.7 7932 2004 0.02693690 ## 12 2004-12-01 8481.5 294694 6.9 9.5 7934 2004 0.02692284 ## ## $`2005` ## # A tibble: 12 × 8 ## date pce pop psavert uempmed unemploy year percent ## <date> <dbl> <dbl> <dbl> <dbl> <dbl> <dbl> <dbl> ## 1 2005-01-01 8470.2 294914 3.7 9.4 7784 2005 0.02639414 ## 2 2005-02-01 8529.2 295105 3.4 9.2 7980 2005 0.02704122 ## 3 2005-03-01 8569.5 295287 3.6 9.3 7737 2005 0.02620163 ## 4 2005-04-01 8645.6 295490 3.1 9 7672 2005 0.02596365 ## 5 2005-05-01 8643.9 295704 3.5 9.1 7651 2005 0.02587385 ## 6 2005-06-01 8724.8 295936 2.9 9 7524 2005 0.02542442 ## 7 2005-07-01 8829.5 296186 2.2 8.8 7406 2005 0.02500456 ## 8 2005-08-01 8832.4 296440 2.7 9.2 7345 2005 0.02477736 ## 9 2005-09-01 8885.8 296707 2.7 8.4 7553 2005 0.02545609 ## 10 2005-10-01 8926.6 296972 3.1 8.6 7453 2005 0.02509664 ## 11 2005-11-01 8938.5 297207 3.5 8.5 7566 2005 0.02545700 ## 12 2005-12-01 8969.6 297431 3.7 8.7 7279 2005 0.02447290 ## ## $`2006` ## # A tibble: 12 × 8 ## date pce pop psavert uempmed unemploy year percent ## <date> <dbl> <dbl> <dbl> <dbl> <dbl> <dbl> <dbl> ## 1 2006-01-01 9059.8 297647 4.2 8.6 7064 2006 0.02373281 ## 2 2006-02-01 9090.1 297854 4.2 9.1 7184 2006 0.02411920 ## 3 2006-03-01 9122.1 298060 4.2 8.7 7072 2006 0.02372677 ## 4 2006-04-01 9174.8 298281 4 8.4 7120 2006 0.02387011 ## 5 2006-05-01 9215.1 298496 3.8 8.5 6980 2006 0.02338390 ## 6 2006-06-01 9240.8 298739 4 7.3 7001 2006 0.02343517 ## 7 2006-07-01 9322.6 298996 3.4 8 7175 2006 0.02399698 ## 8 2006-08-01 9321.8 299263 3.6 8.4 7091 2006 0.02369488 ## 9 2006-09-01 9354.7 299554 3.6 8 6847 2006 0.02285731 ## 10 2006-10-01 9373.2 299835 3.6 7.9 6727 2006 0.02243567 ## 11 2006-11-01 9380.2 300094 3.9 8.3 6872 2006 0.02289949 ## 12 2006-12-01 9469 300340 3.7 7.5 6762 2006 0.02251448 ## ## $`2007` ## # A tibble: 12 × 8 ## date pce pop psavert uempmed unemploy year percent ## <date> <dbl> <dbl> <dbl> <dbl> <dbl> <dbl> <dbl> ## 1 2007-01-01 9516.3 300574 3.7 8.3 7116 2007 0.02367470 ## 2 2007-02-01 9546.8 300802 4.1 8.5 6927 2007 0.02302844 ## 3 2007-03-01 9585.1 301021 4.4 9.1 6731 2007 0.02236057 ## 4 2007-04-01 9615.7 301254 4.2 8.6 6850 2007 0.02273829 ## 5 2007-05-01 9651.3 301483 4 8.2 6766 2007 0.02244239 ## 6 2007-06-01 9667.3 301739 3.8 7.7 6979 2007 0.02312926 ## 7 2007-07-01 9709.6 302004 3.7 8.7 7149 2007 0.02367187 ## 8 2007-08-01 9753.9 302267 3.4 8.8 7067 2007 0.02337999 ## 9 2007-09-01 9797.9 302546 3.5 8.7 7170 2007 0.02369888 ## 10 2007-10-01 9827 302807 3.4 8.4 7237 2007 0.02389971 ## 11 2007-11-01 9897.8 303054 3.1 8.6 7240 2007 0.02389013 ## 12 2007-12-01 9908.4 303287 3.6 8.4 7645 2007 0.02520715 ## ## $`2008` ## # A tibble: 12 × 8 ## date pce pop psavert uempmed unemploy year percent ## <date> <dbl> <dbl> <dbl> <dbl> <dbl> <dbl> <dbl> ## 1 2008-01-01 9930 303506 3.7 9 7685 2008 0.02532075 ## 2 2008-02-01 9913.4 303711 4.1 8.7 7497 2008 0.02468465 ## 3 2008-03-01 9959.4 303907 4 8.7 7822 2008 0.02573814 ## 4 2008-04-01 9996.8 304117 3.4 9.4 7637 2008 0.02511205 ## 5 2008-05-01 10053.8 304323 7.8 7.9 8395 2008 0.02758582 ## 6 2008-06-01 10107.9 304556 5.5 9 8575 2008 0.02815574 ## 7 2008-07-01 10104.7 304798 4.4 9.7 8937 2008 0.02932106 ## 8 2008-08-01 10094.7 305045 3.8 9.7 9438 2008 0.03093970 ## 9 2008-09-01 10043.5 305309 4.7 10.2 9494 2008 0.03109636 ## 10 2008-10-01 9960.3 305554 5.5 10.4 10074 2008 0.03296962 ## 11 2008-11-01 9820.8 305786 6.4 9.8 10538 2008 0.03446201 ## 12 2008-12-01 9730.7 306004 6.4 10.5 11286 2008 0.03688187 ## ## $`2009` ## # A tibble: 12 × 8 ## date pce pop psavert uempmed unemploy year percent ## <date> <dbl> <dbl> <dbl> <dbl> <dbl> <dbl> <dbl> ## 1 2009-01-01 9783.8 306208 6.2 10.7 12058 2009 0.03937846 ## 2 2009-02-01 9766 306402 5.5 11.7 12898 2009 0.04209503 ## 3 2009-03-01 9718.5 306588 5.9 12.3 13426 2009 0.04379167 ## 4 2009-04-01 9724.8 306787 6.8 13.1 13853 2009 0.04515511 ## 5 2009-05-01 9748.9 306984 8.2 14.2 14499 2009 0.04723047 ## 6 2009-06-01 9806.9 307206 6.7 17.2 14707 2009 0.04787341 ## 7 2009-07-01 9841.7 307439 6 16 14601 2009 0.04749235 ## 8 2009-08-01 9961 307685 4.9 16.3 14814 2009 0.04814664 ## 9 2009-09-01 9883.4 307946 5.9 17.8 15009 2009 0.04873906 ## 10 2009-10-01 9931.9 308189 5.4 18.9 15352 2009 0.04981359 ## 11 2009-11-01 9940.5 308418 5.9 19.8 15219 2009 0.04934537 ## 12 2009-12-01 9998.9 308633 5.9 20.1 15098 2009 0.04891894 ## ## $`2010` ## # A tibble: 12 × 8 ## date pce pop psavert uempmed unemploy year percent ## <date> <dbl> <dbl> <dbl> <dbl> <dbl> <dbl> <dbl> ## 1 2010-01-01 10001.8 308833 6.1 20 15046 2010 0.04871889 ## 2 2010-02-01 10030.6 309027 5.8 19.9 15113 2010 0.04890511 ## 3 2010-03-01 10089.1 309212 5.7 20.4 15202 2010 0.04916368 ## 4 2010-04-01 10112.9 309191.2 6.4 22.1 15325 2010 0.04956480 ## 5 2010-05-01 10131 309369.1 7 22.3 14849 2010 0.04799769 ## 6 2010-06-01 10151.4 309548.5 6.9 25.2 14474 2010 0.04675842 ## 7 2010-07-01 10184.7 309745.7 6.8 22.3 14512 2010 0.04685134 ## 8 2010-08-01 10228.2 309957.8 6.9 21 14648 2010 0.04725805 ## 9 2010-09-01 10249 310176.5 6.7 20.3 14579 2010 0.04700228 ## 10 2010-10-01 10304.7 310400.0 6.6 21.2 14516 2010 0.04676547 ## 11 2010-11-01 10354.7 310595.8 6.6 21 15081 2010 0.04855507 ## 12 2010-12-01 10392.1 310781.7 7.1 21.9 14348 2010 0.04616745 ## ## $`2011` ## # A tibble: 12 × 8 ## date pce pop psavert uempmed unemploy year percent ## <date> <dbl> <dbl> <dbl> <dbl> <dbl> <dbl> <dbl> ## 1 2011-01-01 10435.5 310960.7 7.4 21.5 14013 2011 0.04506357 ## 2 2011-02-01 10470.1 311113.4 7.6 21.1 13820 2011 0.04442111 ## 3 2011-03-01 10550.5 311265.4 7 21.5 13737 2011 0.04413276 ## 4 2011-04-01 10587.6 311436.2 6.9 20.9 13957 2011 0.04481495 ## 5 2011-05-01 10612 311607.1 6.9 21.6 13855 2011 0.04446305 ## 6 2011-06-01 10636.8 311791.2 7.2 22.4 13962 2011 0.04477996 ## 7 2011-07-01 10677.5 311997.0 7.3 22 13763 2011 0.04411260 ## 8 2011-08-01 10700.6 312205.4 7.2 22.4 13818 2011 0.04425933 ## 9 2011-09-01 10738.1 312429.1 6.8 22 13948 2011 0.04464373 ## 10 2011-10-01 10753.1 312644.2 6.8 20.6 13594 2011 0.04348074 ## 11 2011-11-01 10759.5 312829.5 7 20.8 13302 2011 0.04252156 ## 12 2011-12-01 10772.2 313009.7 7.8 20.5 13093 2011 0.04182937 ## ## $`2012` ## # A tibble: 12 × 8 ## date pce pop psavert uempmed unemploy year percent ## <date> <dbl> <dbl> <dbl> <dbl> <dbl> <dbl> <dbl> ## 1 2012-01-01 10862.1 313183.2 8 20.8 12797 2012 0.04086107 ## 2 2012-02-01 10953.5 313339.0 8 19.7 12813 2012 0.04089182 ## 3 2012-03-01 10951.8 313499.4 8.5 19.2 12713 2012 0.04055192 ## 4 2012-04-01 10979.7 313667.1 8.7 19.1 12646 2012 0.04031663 ## 5 2012-05-01 10968.6 313830.5 8.8 19.9 12660 2012 0.04034024 ## 6 2012-06-01 10946.3 314017.6 9.1 20.4 12692 2012 0.04041812 ## 7 2012-07-01 10977.2 314210.8 8.2 17.5 12656 2012 0.04027869 ## 8 2012-08-01 11004.1 314422.3 8 18.4 12471 2012 0.03966321 ## 9 2012-09-01 11061.5 314646.7 8.2 18.8 12115 2012 0.03850350 ## 10 2012-10-01 11099.8 314854.0 8.8 19.9 12124 2012 0.03850674 ## 11 2012-11-01 11136.8 315053.9 9.7 18.6 12005 2012 0.03810460 ## 12 2012-12-01 11140.5 315232.8 12 17.7 12298 2012 0.03901244 ## ## $`2013` ## # A tibble: 12 × 8 ## date pce pop psavert uempmed unemploy year percent ## <date> <dbl> <dbl> <dbl> <dbl> <dbl> <dbl> <dbl> ## 1 2013-01-01 11202.8 315389.6 6.3 15.8 12471 2013 0.03954157 ## 2 2013-02-01 11239.6 315520.1 5.8 17.2 11950 2013 0.03787397 ## 3 2013-03-01 11227.1 315662.2 5.9 17.6 11689 2013 0.03703009 ## 4 2013-04-01 11205.4 315817.9 6.4 17.1 11760 2013 0.03723665 ## 5 2013-05-01 11244.6 315983.7 6.7 17.1 11654 2013 0.03688165 ## 6 2013-06-01 11268.8 316171.0 6.8 17 11751 2013 0.03716659 ## 7 2013-07-01 11296.7 316358.8 6.6 16.2 11335 2013 0.03582957 ## 8 2013-08-01 11329.2 316580.3 6.7 16.5 11279 2013 0.03562761 ## 9 2013-09-01 11366.9 316806.1 6.8 16.5 11270 2013 0.03557381 ## 10 2013-10-01 11419.8 317022.3 6.3 16.3 11136 2013 0.03512687 ## 11 2013-11-01 11487.6 317228.0 6.2 17.1 10787 2013 0.03400393 ## 12 2013-12-01 11517.9 317411.6 6.4 17.3 10404 2013 0.03277764 ## ## $`2014` ## # A tibble: 12 × 8 ## date pce pop psavert uempmed unemploy year percent ## <date> <dbl> <dbl> <dbl> <dbl> <dbl> <dbl> <dbl> ## 1 2014-01-01 11512.5 317593.9 7.1 15.4 10202 2014 0.03212278 ## 2 2014-02-01 11566.2 317753.9 7.3 15.9 10349 2014 0.03256923 ## 3 2014-03-01 11643 317917.2 7.4 15.8 10380 2014 0.03265001 ## 4 2014-04-01 11702.6 318089.2 7.4 15.7 9702 2014 0.03050088 ## 5 2014-05-01 11748.4 318269.5 7.4 14.6 9859 2014 0.03097689 ## 6 2014-06-01 11817 318464.2 7.4 13.8 9460 2014 0.02970507 ## 7 2014-07-01 11860.5 318662.4 7.5 13.1 9608 2014 0.03015103 ## 8 2014-08-01 11944.3 318893.8 7.2 12.9 9599 2014 0.03010093 ## 9 2014-09-01 11957.4 319125.3 7.4 13.4 9262 2014 0.02902308 ## 10 2014-10-01 12023 319353.7 7.2 13.6 8990 2014 0.02815060 ## 11 2014-11-01 12051.4 319564.2 7.3 13 9090 2014 0.02844499 ## 12 2014-12-01 12062 319746.2 7.6 12.9 8717 2014 0.02726225 ## ## $`2015` ## # A tibble: 4 × 8 ## date pce pop psavert uempmed unemploy year percent ## <date> <dbl> <dbl> <dbl> <dbl> <dbl> <dbl> <dbl> ## 1 2015-01-01 12046 319928.6 7.7 13.2 8903 2015 0.02782808 ## 2 2015-02-01 12082.4 320074.5 7.9 12.9 8610 2015 0.02689999 ## 3 2015-03-01 12158.3 320230.8 7.4 12 8504 2015 0.02655585 ## 4 2015-04-01 12193.8 320402.3 7.6 11.5 8526 2015 0.02661030 ``` --- ```r by_year %>% map(~mutate(.x, percent = unemploy / pop)) %>% map(~lm(percent ~ pce, data = .x)) ``` ``` ## $`1967` ## ## Call: ## lm(formula = percent ~ pce, data = .x) ## ## Coefficients: ## (Intercept) pce ## 8.397e-03 1.307e-05 ## ## ## $`1968` ## ## Call: ## lm(formula = percent ~ pce, data = .x) ## ## Coefficients: ## (Intercept) pce ## 2.785e-02 -2.497e-05 ## ## ## $`1969` ## ## Call: ## lm(formula = percent ~ pce, data = .x) ## ## Coefficients: ## (Intercept) pce ## -5.363e-03 3.202e-05 ## ## ## $`1970` ## ## Call: ## lm(formula = percent ~ pce, data = .x) ## ## Coefficients: ## (Intercept) pce ## -0.1180578 0.0002137 ## ## ## $`1971` ## ## Call: ## lm(formula = percent ~ pce, data = .x) ## ## Coefficients: ## (Intercept) pce ## 1.595e-02 1.177e-05 ## ## ## $`1972` ## ## Call: ## lm(formula = percent ~ pce, data = .x) ## ## Coefficients: ## (Intercept) pce ## 4.404e-02 -2.708e-05 ## ## ## $`1973` ## ## Call: ## lm(formula = percent ~ pce, data = .x) ## ## Coefficients: ## (Intercept) pce ## 2.571e-02 -6.047e-06 ## ## ## $`1974` ## ## Call: ## lm(formula = percent ~ pce, data = .x) ## ## Coefficients: ## (Intercept) pce ## -5.070e-02 8.051e-05 ## ## ## $`1975` ## ## Call: ## lm(formula = percent ~ pce, data = .x) ## ## Coefficients: ## (Intercept) pce ## 3.847e-02 -1.644e-06 ## ## ## $`1976` ## ## Call: ## lm(formula = percent ~ pce, data = .x) ## ## Coefficients: ## (Intercept) pce ## 2.313e-02 9.414e-06 ## ## ## $`1977` ## ## Call: ## lm(formula = percent ~ pce, data = .x) ## ## Coefficients: ## (Intercept) pce ## 7.454e-02 -3.367e-05 ## ## ## $`1978` ## ## Call: ## lm(formula = percent ~ pce, data = .x) ## ## Coefficients: ## (Intercept) pce ## 4.419e-02 -1.152e-05 ## ## ## $`1979` ## ## Call: ## lm(formula = percent ~ pce, data = .x) ## ## Coefficients: ## (Intercept) pce ## 1.932e-02 5.012e-06 ## ## ## $`1980` ## ## Call: ## lm(formula = percent ~ pce, data = .x) ## ## Coefficients: ## (Intercept) pce ## -0.0074548 0.0000235 ## ## ## $`1981` ## ## Call: ## lm(formula = percent ~ pce, data = .x) ## ## Coefficients: ## (Intercept) pce ## -2.494e-02 3.151e-05 ## ## ## $`1982` ## ## Call: ## lm(formula = percent ~ pce, data = .x) ## ## Coefficients: ## (Intercept) pce ## -8.882e-02 6.516e-05 ## ## ## $`1983` ## ## Call: ## lm(formula = percent ~ pce, data = .x) ## ## Coefficients: ## (Intercept) pce ## 1.461e-01 -4.402e-05 ## ## ## $`1984` ## ## Call: ## lm(formula = percent ~ pce, data = .x) ## ## Coefficients: ## (Intercept) pce ## 7.893e-02 -1.718e-05 ## ## ## $`1985` ## ## Call: ## lm(formula = percent ~ pce, data = .x) ## ## Coefficients: ## (Intercept) pce ## 5.366e-02 -6.927e-06 ## ## ## $`1986` ## ## Call: ## lm(formula = percent ~ pce, data = .x) ## ## Coefficients: ## (Intercept) pce ## 5.385e-02 -6.783e-06 ## ## ## $`1987` ## ## Call: ## lm(formula = percent ~ pce, data = .x) ## ## Coefficients: ## (Intercept) pce ## 0.0914664 -0.0000198 ## ## ## $`1988` ## ## Call: ## lm(formula = percent ~ pce, data = .x) ## ## Coefficients: ## (Intercept) pce ## 5.123e-02 -7.174e-06 ## ## ## $`1989` ## ## Call: ## lm(formula = percent ~ pce, data = .x) ## ## Coefficients: ## (Intercept) pce ## 1.051e-02 4.437e-06 ## ## ## $`1990` ## ## Call: ## lm(formula = percent ~ pce, data = .x) ## ## Coefficients: ## (Intercept) pce ## -7.123e-02 2.611e-05 ## ## ## $`1991` ## ## Call: ## lm(formula = percent ~ pce, data = .x) ## ## Coefficients: ## (Intercept) pce ## -3.857e-02 1.843e-05 ## ## ## $`1992` ## ## Call: ## lm(formula = percent ~ pce, data = .x) ## ## Coefficients: ## (Intercept) pce ## 3.487e-02 6.091e-07 ## ## ## $`1993` ## ## Call: ## lm(formula = percent ~ pce, data = .x) ## ## Coefficients: ## (Intercept) pce ## 9.538e-02 -1.372e-05 ## ## ## $`1994` ## ## Call: ## lm(formula = percent ~ pce, data = .x) ## ## Coefficients: ## (Intercept) pce ## 1.295e-01 -2.102e-05 ## ## ## $`1995` ## ## Call: ## lm(formula = percent ~ pce, data = .x) ## ## Coefficients: ## (Intercept) pce ## 2.397e-02 7.718e-07 ## ## ## $`1996` ## ## Call: ## lm(formula = percent ~ pce, data = .x) ## ## Coefficients: ## (Intercept) pce ## 5.602e-02 -5.567e-06 ## ## ## $`1997` ## ## Call: ## lm(formula = percent ~ pce, data = .x) ## ## Coefficients: ## (Intercept) pce ## 7.968e-02 -9.937e-06 ## ## ## $`1998` ## ## Call: ## lm(formula = percent ~ pce, data = .x) ## ## Coefficients: ## (Intercept) pce ## 3.590e-02 -2.283e-06 ## ## ## $`1999` ## ## Call: ## lm(formula = percent ~ pce, data = .x) ## ## Coefficients: ## (Intercept) pce ## 3.923e-02 -2.894e-06 ## ## ## $`2000` ## ## Call: ## lm(formula = percent ~ pce, data = .x) ## ## Coefficients: ## (Intercept) pce ## 3.097e-02 -1.602e-06 ## ## ## $`2001` ## ## Call: ## lm(formula = percent ~ pce, data = .x) ## ## Coefficients: ## (Intercept) pce ## -1.881e-01 3.001e-05 ## ## ## $`2002` ## ## Call: ## lm(formula = percent ~ pce, data = .x) ## ## Coefficients: ## (Intercept) pce ## 1.428e-02 2.015e-06 ## ## ## $`2003` ## ## Call: ## lm(formula = percent ~ pce, data = .x) ## ## Coefficients: ## (Intercept) pce ## 4.026e-02 -1.307e-06 ## ## ## $`2004` ## ## Call: ## lm(formula = percent ~ pce, data = .x) ## ## Coefficients: ## (Intercept) pce ## 5.764e-02 -3.640e-06 ## ## ## $`2005` ## ## Call: ## lm(formula = percent ~ pce, data = .x) ## ## Coefficients: ## (Intercept) pce ## 5.778e-02 -3.679e-06 ## ## ## $`2006` ## ## Call: ## lm(formula = percent ~ pce, data = .x) ## ## Coefficients: ## (Intercept) pce ## 5.458e-02 -3.369e-06 ## ## ## $`2007` ## ## Call: ## lm(formula = percent ~ pce, data = .x) ## ## Coefficients: ## (Intercept) pce ## -1.722e-02 4.188e-06 ## ## ## $`2008` ## ## Call: ## lm(formula = percent ~ pce, data = .x) ## ## Coefficients: ## (Intercept) pce ## 1.785e-01 -1.495e-05 ## ## ## $`2009` ## ## Call: ## lm(formula = percent ~ pce, data = .x) ## ## Coefficients: ## (Intercept) pce ## -1.73e-01 2.23e-05 ## ## ## $`2010` ## ## Call: ## lm(formula = percent ~ pce, data = .x) ## ## Coefficients: ## (Intercept) pce ## 1.073e-01 -5.844e-06 ## ## ## $`2011` ## ## Call: ## lm(formula = percent ~ pce, data = .x) ## ## Coefficients: ## (Intercept) pce ## 1.041e-01 -5.647e-06 ## ## ## $`2012` ## ## Call: ## lm(formula = percent ~ pce, data = .x) ## ## Coefficients: ## (Intercept) pce ## 0.1575956 -0.0000107 ## ## ## $`2013` ## ## Call: ## lm(formula = percent ~ pce, data = .x) ## ## Coefficients: ## (Intercept) pce ## 2.101e-01 -1.536e-05 ## ## ## $`2014` ## ## Call: ## lm(formula = percent ~ pce, data = .x) ## ## Coefficients: ## (Intercept) pce ## 1.317e-01 -8.591e-06 ## ## ## $`2015` ## ## Call: ## lm(formula = percent ~ pce, data = .x) ## ## Coefficients: ## (Intercept) pce ## 1.177e-01 -7.482e-06 ``` --- ```r by_year %>% map(~mutate(.x, percent = unemploy / pop)) %>% map(~lm(percent ~ pce, data = .x)) %>% map(coef) ``` ``` ## $`1967` ## (Intercept) pce ## 8.397192e-03 1.307101e-05 ## ## $`1968` ## (Intercept) pce ## 2.784626e-02 -2.496983e-05 ## ## $`1969` ## (Intercept) pce ## -5.362991e-03 3.201794e-05 ## ## $`1970` ## (Intercept) pce ## -0.1180577869 0.0002136662 ## ## $`1971` ## (Intercept) pce ## 1.594909e-02 1.177357e-05 ## ## $`1972` ## (Intercept) pce ## 0.0440400392 -0.0000270806 ## ## $`1973` ## (Intercept) pce ## 2.571465e-02 -6.047148e-06 ## ## $`1974` ## (Intercept) pce ## -5.069693e-02 8.050869e-05 ## ## $`1975` ## (Intercept) pce ## 3.847047e-02 -1.643992e-06 ## ## $`1976` ## (Intercept) pce ## 2.313211e-02 9.413733e-06 ## ## $`1977` ## (Intercept) pce ## 7.453726e-02 -3.366894e-05 ## ## $`1978` ## (Intercept) pce ## 4.418640e-02 -1.151756e-05 ## ## $`1979` ## (Intercept) pce ## 1.932149e-02 5.011539e-06 ## ## $`1980` ## (Intercept) pce ## -0.0074548418 0.0000235041 ## ## $`1981` ## (Intercept) pce ## -2.494231e-02 3.150845e-05 ## ## $`1982` ## (Intercept) pce ## -8.881640e-02 6.516215e-05 ## ## $`1983` ## (Intercept) pce ## 1.461015e-01 -4.402208e-05 ## ## $`1984` ## (Intercept) pce ## 7.892629e-02 -1.718497e-05 ## ## $`1985` ## (Intercept) pce ## 5.366118e-02 -6.926535e-06 ## ## $`1986` ## (Intercept) pce ## 5.384654e-02 -6.782516e-06 ## ## $`1987` ## (Intercept) pce ## 9.146640e-02 -1.980421e-05 ## ## $`1988` ## (Intercept) pce ## 5.122852e-02 -7.174276e-06 ## ## $`1989` ## (Intercept) pce ## 1.051097e-02 4.436762e-06 ## ## $`1990` ## (Intercept) pce ## -7.123114e-02 2.611286e-05 ## ## $`1991` ## (Intercept) pce ## -3.856927e-02 1.842612e-05 ## ## $`1992` ## (Intercept) pce ## 3.487276e-02 6.091330e-07 ## ## $`1993` ## (Intercept) pce ## 9.537911e-02 -1.371548e-05 ## ## $`1994` ## (Intercept) pce ## 1.295460e-01 -2.102375e-05 ## ## $`1995` ## (Intercept) pce ## 2.396737e-02 7.718004e-07 ## ## $`1996` ## (Intercept) pce ## 5.602360e-02 -5.567328e-06 ## ## $`1997` ## (Intercept) pce ## 7.968484e-02 -9.936855e-06 ## ## $`1998` ## (Intercept) pce ## 3.589534e-02 -2.283149e-06 ## ## $`1999` ## (Intercept) pce ## 3.922715e-02 -2.893646e-06 ## ## $`2000` ## (Intercept) pce ## 3.097125e-02 -1.601844e-06 ## ## $`2001` ## (Intercept) pce ## -1.881272e-01 3.001365e-05 ## ## $`2002` ## (Intercept) pce ## 1.428471e-02 2.014789e-06 ## ## $`2003` ## (Intercept) pce ## 4.025941e-02 -1.306818e-06 ## ## $`2004` ## (Intercept) pce ## 5.763951e-02 -3.640025e-06 ## ## $`2005` ## (Intercept) pce ## 5.777898e-02 -3.679151e-06 ## ## $`2006` ## (Intercept) pce ## 5.458272e-02 -3.368536e-06 ## ## $`2007` ## (Intercept) pce ## -1.721961e-02 4.187576e-06 ## ## $`2008` ## (Intercept) pce ## 1.784624e-01 -1.494605e-05 ## ## $`2009` ## (Intercept) pce ## -1.729902e-01 2.230078e-05 ## ## $`2010` ## (Intercept) pce ## 1.073378e-01 -5.844266e-06 ## ## $`2011` ## (Intercept) pce ## 1.041383e-01 -5.647401e-06 ## ## $`2012` ## (Intercept) pce ## 1.575956e-01 -1.070319e-05 ## ## $`2013` ## (Intercept) pce ## 2.101046e-01 -1.536441e-05 ## ## $`2014` ## (Intercept) pce ## 1.317146e-01 -8.590683e-06 ## ## $`2015` ## (Intercept) pce ## 1.176573e-01 -7.482080e-06 ``` --- ```r slopes <- by_year %>% map(~mutate(.x, percent = unemploy / pop)) %>% map(~lm(percent ~ pce, data = .x)) %>% map(coef) %>% map_dbl(2) slopes ``` ``` ## 1967 1968 1969 1970 1971 1972 ## 1.307101e-05 -2.496983e-05 3.201794e-05 2.136662e-04 1.177357e-05 -2.708060e-05 ## 1973 1974 1975 1976 1977 1978 ## -6.047148e-06 8.050869e-05 -1.643992e-06 9.413733e-06 -3.366894e-05 -1.151756e-05 ## 1979 1980 1981 1982 1983 1984 ## 5.011539e-06 2.350410e-05 3.150845e-05 6.516215e-05 -4.402208e-05 -1.718497e-05 ## 1985 1986 1987 1988 1989 1990 ## -6.926535e-06 -6.782516e-06 -1.980421e-05 -7.174276e-06 4.436762e-06 2.611286e-05 ## 1991 1992 1993 1994 1995 1996 ## 1.842612e-05 6.091330e-07 -1.371548e-05 -2.102375e-05 7.718004e-07 -5.567328e-06 ## 1997 1998 1999 2000 2001 2002 ## -9.936855e-06 -2.283149e-06 -2.893646e-06 -1.601844e-06 3.001365e-05 2.014789e-06 ## 2003 2004 2005 2006 2007 2008 ## -1.306818e-06 -3.640025e-06 -3.679151e-06 -3.368536e-06 4.187576e-06 -1.494605e-05 ## 2009 2010 2011 2012 2013 2014 ## 2.230078e-05 -5.844266e-06 -5.647401e-06 -1.070319e-05 -1.536441e-05 -8.590683e-06 ## 2015 ## -7.482080e-06 ``` --- class: inverse-blue middle # More Practice ## If we have time before the lab --- # Practice * Compute the standard deviation of every mtcars column. * Copy and run the following code to obtain 50 bootstrap samples ```r bootstrap <- function(df) { df[sample(nrow(df), replace = TRUE), , drop = FALSE] } samples <- map(1:50, ~bootstrap(mtcars)) ``` * Fit the following model to each bootstrap sample: `mpg ~ disp` * Extract `\(R^2\)` and plot the distribution --- class: inverse-green middle # Lab 2 ## Midterm quiz next week